This is an updated version of an old post - I ran the script again against the latest updates in the Julia repository.
Infographic
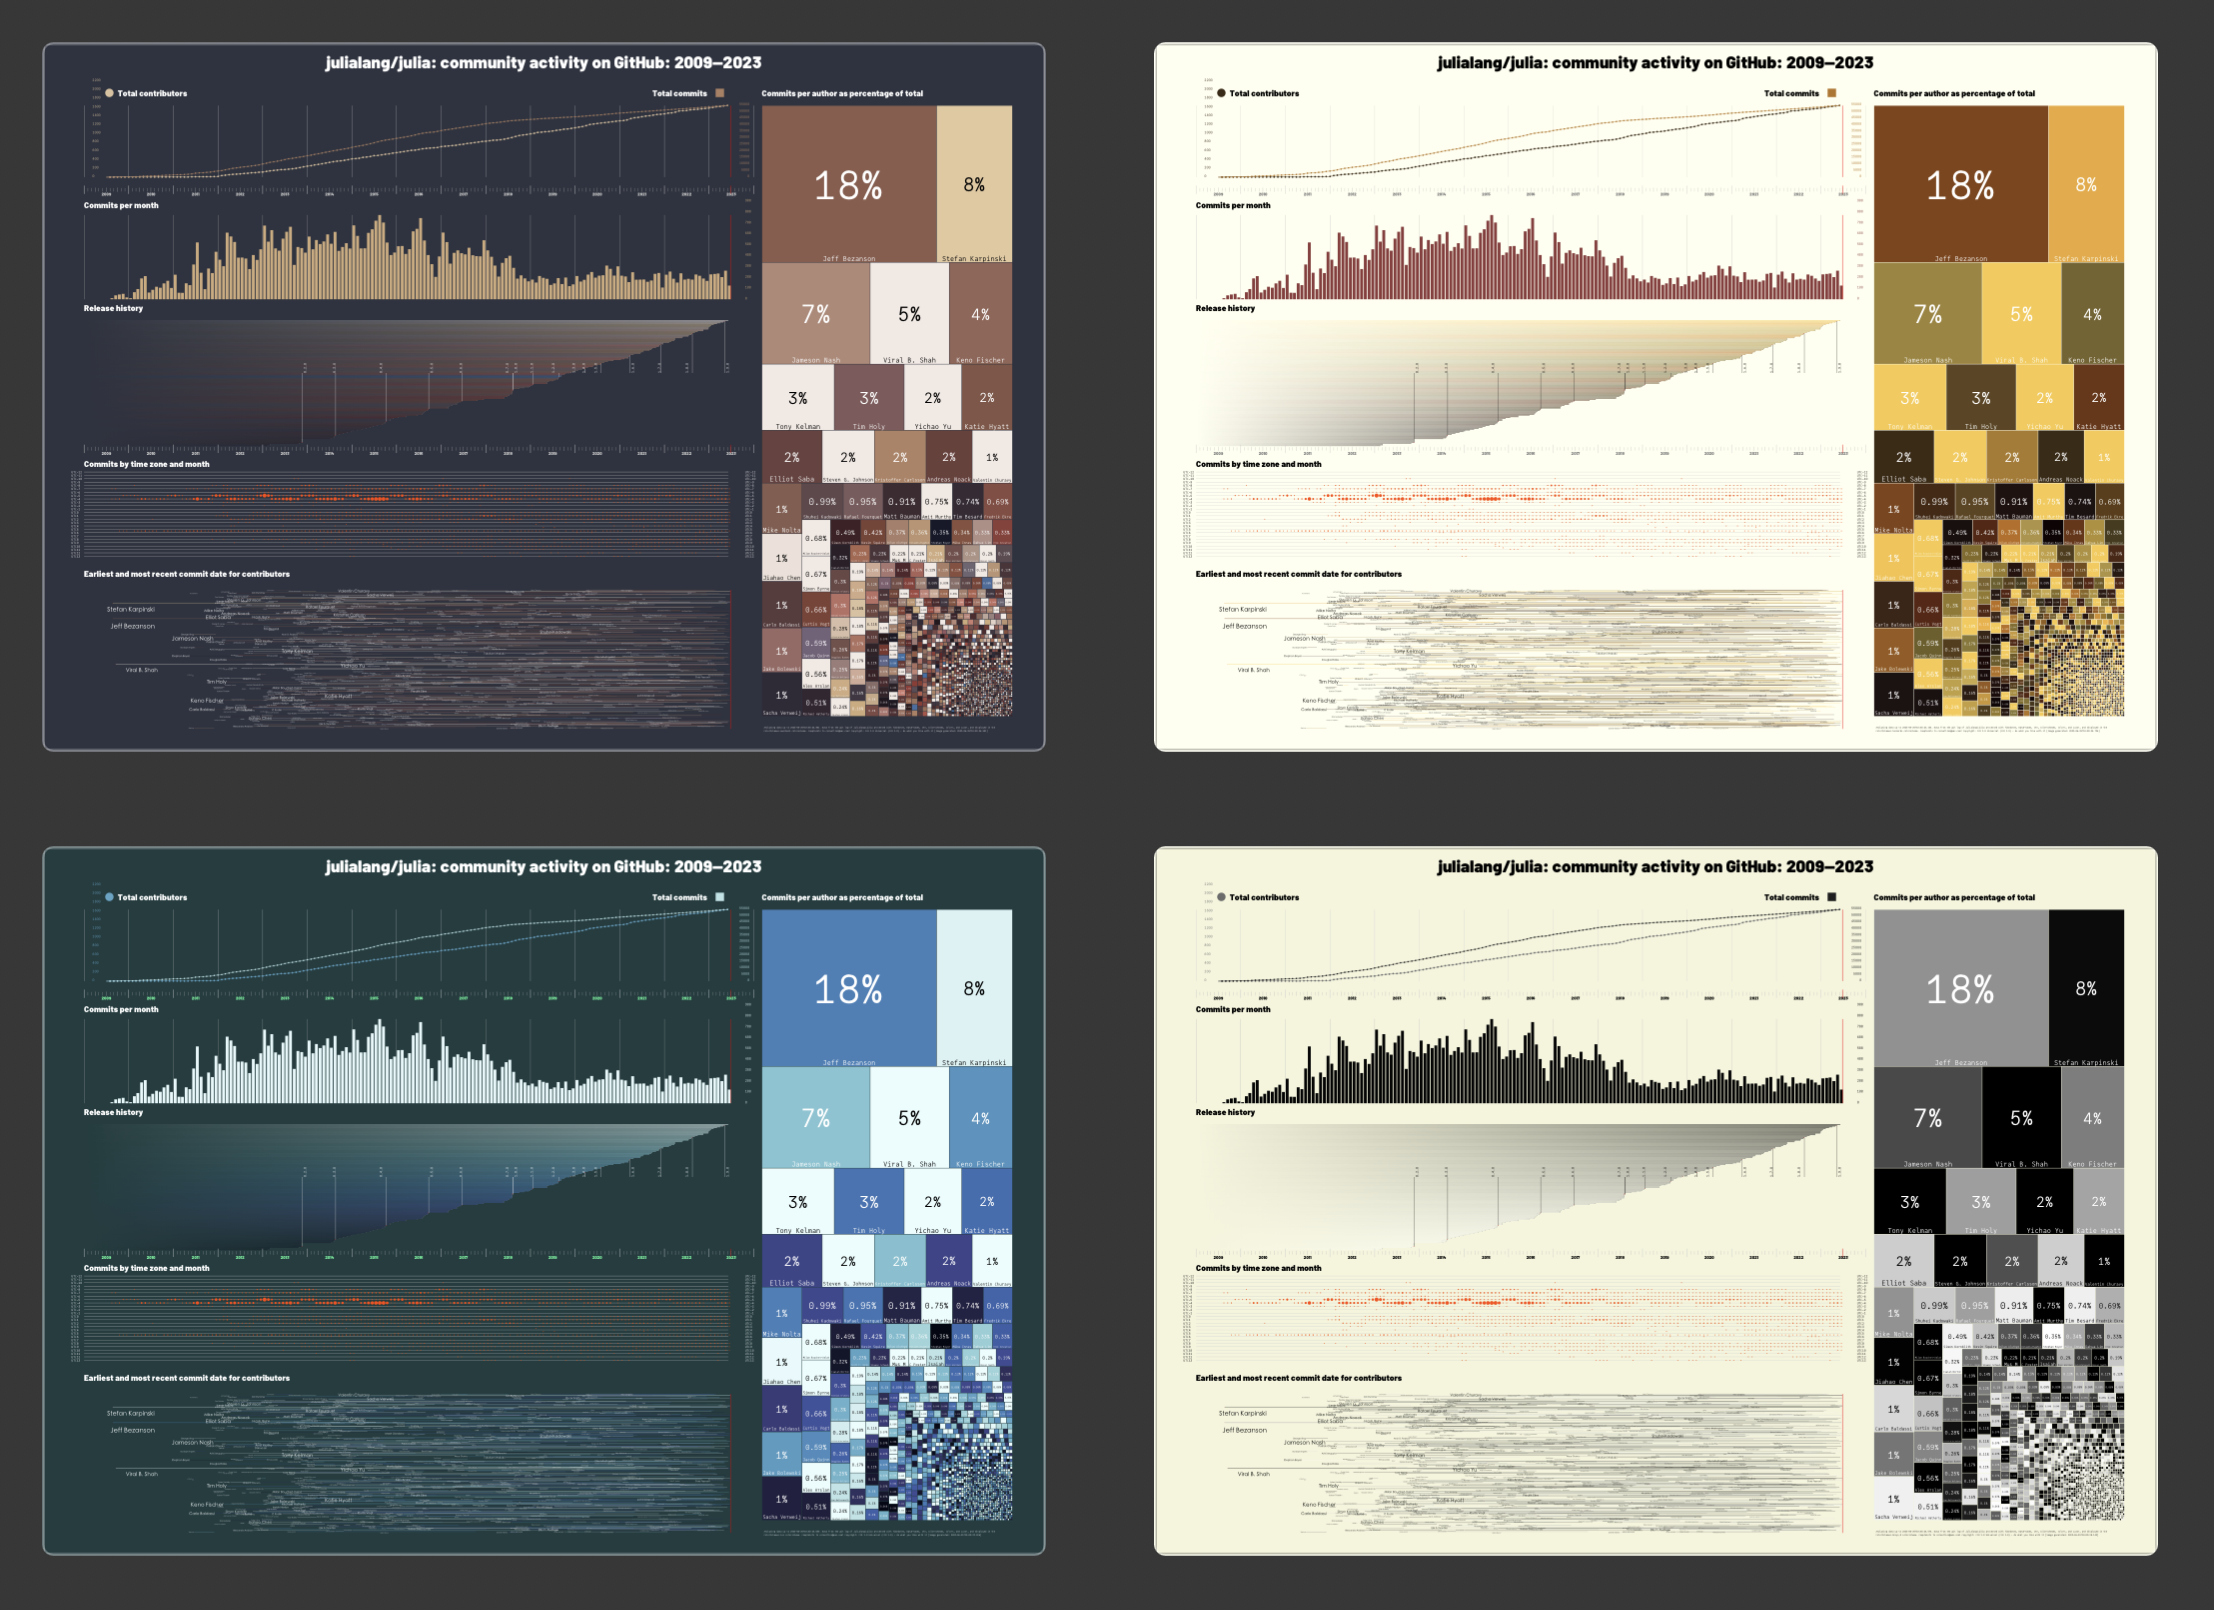
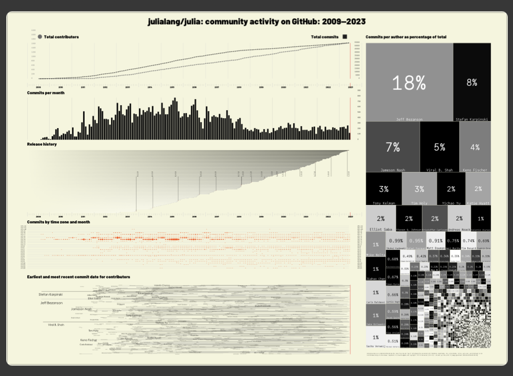
Instead of my usual graphical doodles, I thought I'd try to draw an infographic about Julia. I got hold of the git log for the main Julia repository on github.com, and rendered it visually.
A good infographic can both confirm and reveal truths about the data. Usually the visuals confirm what we probably already know, or could easily find out from scanning the numbers in a table. There's nothing wrong with that; it can enable faster and better communication, and promote wider understanding. Occasionally, though, an infographic can reveal new things that you might not have spotted without the graphical interpretation. Either way, an infographic can offer both Confirmation and Revelation.
There are four different colorschemes, I couldn't decide which to use:
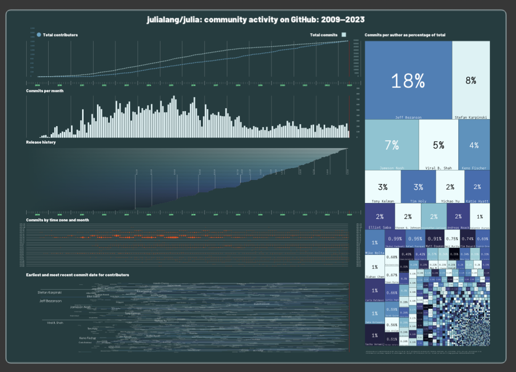
ice:
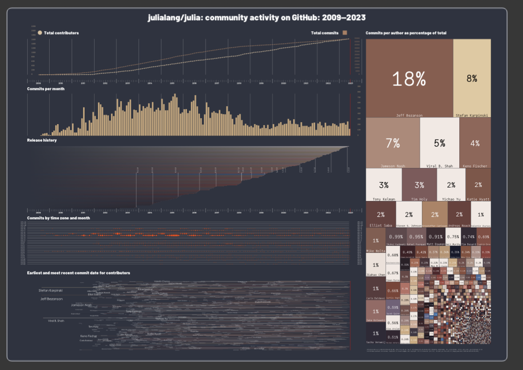
leonardo:
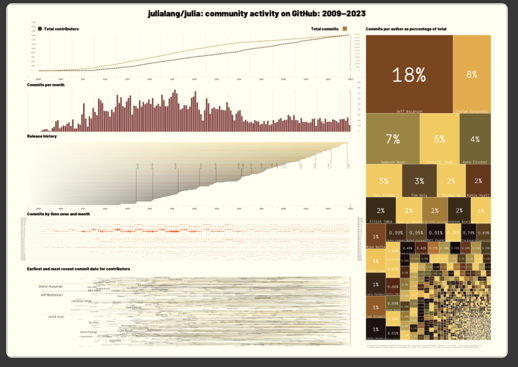
auerbach:
greys:
The rest of this post consists of implementation notes.

Commits as data units
The git log contains all the commits to the repository. A commit is a precise piece of information in some ways, but is quite loosely defined in others. For example, a single commit might be a substantial addition to the language, the final result of months of intensive work. Or it could be merely the addition of a missing Oxford comma in a docstring, the work of a few seconds.
One of the great things about Julia is that you don't have to be an advanced programmer to contribute to its development.
It's possible to retrieve added and deleted line counts for each commit. This might give some indication of the importance of the associated work. But then, sometimes it takes a long time to find and fix a misfeature that's caused by a small amount of erroneous code. And is it better to remove lines of code or documentation, or add them? Rewriting and refactoring doesn't automatically lead to more or less code.
So I'd consider the frequency and quantity of commits a indication of activity but not too much more. In other words, don't draw conclusions in ink, but sketch a few thoughts with a pencil.
You can obtain the git log of a repository at the Julia REPL using the nifty pipeline() function (here's the documentation). This lets you chain shell commands together without having to worry about escaping half the characters in the ASCII table:
repo = "Julia"
cd("/Users/me/.julia/dev/$(repo)")
run(pipeline(`git log
    --after "2014-02-01"
    --before "2016-02-02"`,
    stdout="/tmp/$(repo)-gitlog.csv"))
There are lots of options to git log, useful for obtaining things like dates in the required format.
Once loaded into a DataFrame, I used functions from the TimeZones.jl package to retrieve the time zone data. This package provides a new type, the ZonedDateTime. So if you have a list of dates as strings:
dates = ["2014-06-21 20:27:12 -0400",
         "2014-06-22 08:42:34 +0530",
         "2014-06-21 18:55:37 -0400",
         "2014-06-21 18:17:57 -0400",
         "2014-06-21 18:08:18 -0400",
         "2014-06-21 17:50:48 -0400",
         "2014-06-21 16:54:24 -0400",
         "2014-06-21 16:28:08 -0400",
         "2014-06-21 15:08:14 -0500",
         "2014-06-21 14:58:17 -0400",
         "2014-06-21 14:44:11 -0400",
         "2014-06-21 14:41:45 -0400",
         "2014-06-21 14:41:37 -0400",
         "2014-06-18 21:34:03 -0400",
         "2014-06-21 13:00:22 -0500",
         "2014-06-21 10:48:42 -0700",
         "2014-06-21 10:45:51 -0500",
         "2014-06-20 23:23:06 -0400"]
you can convert them into ZonedDateTimes with:
ZonedDateTime.(dates)or extract just the zones with:
getfield.(ZonedDateTime.(dates, "yyyy-mm-dd H:M:S z"), :zone)giving you:
18-element Array{TimeZones.FixedTimeZone,1}:
 UTC-04:00
 UTC+05:30
 UTC-04:00
 UTC-04:00
 UTC-04:00
 UTC-04:00
 UTC-04:00
 UTC-04:00
 UTC-05:00
 UTC-04:00
 UTC-04:00
 UTC-04:00
 UTC-04:00
 UTC-04:00
 UTC-05:00
 UTC-07:00
 UTC-05:00
 UTC-04:00
Noise in the data
I doubt whether many data sources are perfect. I couldn't check for all possible errors in the incoming git log file. But I did notice a few things that I'd thought I'd repair. For example, I noticed that occasionally different names appeared for the same person:
5×2 DataFrames.DataFrame
│ Row │ Author              │ Count │
├─────┼─────────────────────┼───────┤
│ 1   │ Jeff Bezanson       │ 8801  │
│ 2   │ JeffBezanson        │ 48    │
│ 3   │ Jeffrey Bezanson    │ 34    │
│ 4   │ Jeffrey W. Bezanson │ 21    │
│ 5   │ Jeffrey W Bezanson  │ 1     │
I'm hoping these are all the same Jeff, because I grouped them together (after searching github.com just in case...).
After spotting that, I spent a bit of time with Combinatorics.jl and Levenshtein.jl, running over all combinations of author names with distances below 4 or 5. I found a few and renamed them, I hope correctly, but cautiously decided to leave some unchanged.

Total contributors and total commits
The graphs for total contributors and total commits weren't very interesting (at least visually speaking—it's really cool in reality!). Obviously, each new contributor brings at least one commit, so there's naturally some correlation.
Perhaps one day the early days of the creation of Julia leading up to the first commit will be told and dramatized on TV.
The Commits per month bar chart shows how many commits were made in each month. Perhaps you can spot a pre-release increase, or a post-release relaxation?

Please release me
I thought I'd add data about Julia releases. Obtaining this was a bit of a pain, because I ended up on GitHub GraphQL API v4, trying to use GraphQL, which is about as user-friendly as a hungry tiger trying to order groceries online, but eventually I got something useful in JSON, and JSON.jl did the rest. Once converted to Julia's nifty version strings, I could then extract the release numbers and use them for useful and important tasks, such as choosing colors.
I avoided starting the line for each release in an obvious place, and marked just the release date precisely. The increasing saturation and changing colors of the bars breaks more than one of Professor Edward Tufte's Ten Commandments; all the "ink" in these bars represents virtually zero data, and, with those vague blends, defies commandments numbers 1 and 2 (whatever they are).

In the zone
I assumed that the time zone information stored in the git log is mostly correct. I don't understand time zones. My excuse is that I live in the land of Greenwich Mean Time, UTC 0, and can just about cope with British Summer Time.
It's easy to spot the main centers of Julia development—the distinctive 5 hour and 30 minute offset from UTC of Indian Standard Time is a steady signal dominated though by the primary Julia community living in the UTC-4 and UTC-5 zones, and the recent increase in activity from the UTC+2 zone.
There are a few examples of commits from authors in multiple time zones in the space of a few minutes. This could be evidence of some very high speed travel, but more likely the result of virtuoso performances on the keyboards.

The first shall be last
The lowest panel on the infographic is an attempt to draw each contributor's earliest and most recent commits, joined with a line. At normal viewing scale, it's a thicket of unreadability, but if you zoom in you might be able to see more of the contributors' names, in font sizes that are scaled relative to their share of the total. It was difficult to avoid the names overlapping other names.
Of course, the recent endpoints aren't permanently fixed - people do move on to other things but may come back. Anyway, you don't always have to make new commits to the base language to continue contributing to Julia.
I'd like to say that you can search for names in the PDF using a PDF viewer, but I did notice some small problems with overlapping text and indexing (that's either a bug or a feature) in some PDF reader applications, so I can't promise.
It's also worth remembering that this is only showing the base Julia repository; many Julia contributors are very active in other areas of the Julia ecosystem. I'm not going to attempt to draw the entire Juliaverse. At least not yet.

Little boxes
The boxmap on the right-hand side shows each contributors' share of the Julia language in terms of percentages of commits to the main repository. It clearly shows the 'long tail' of the community. You could say that 50% of the Julia language is written by about six people. Equally you could say that 50% is written by the rest of the contributors. It's probably safe to say that that first 50% is probably the more important half, but some of these smaller boxes will represent significant commits that are just as important.
I was unsure about including the names of individuals here because, obviously, there's just not enough room to include everyone's name; it's good to include everyone, and bad to miss people out. At least everyone has a box of their own, even if it's too small to be located or labelled.
The colors are not significant. It would mostly work without different colors at all, but the contrast between adjacent boxes is useful. With so many boxes to be drawn, some people will most likely have to share the same color, because 'for aesthetic reasons' all colors are chosen from a single colorscheme provided by ColorSchemes.jl. The color of the box is found by hashing the author's name to get a decimal number to place it somewhere on the [0, 1] color scale.
Sidenote: In preparing the data, I needed a function to find the duplicates in an array. Surprisingly Julia doesn't have a built-in function to do this, but the awesome Matt Bauman wrote this elegantly simple solution in about 15 seconds after I asked:
function repeated_elements(A::AbstractVector)
    seen = Set{eltype(A)}()
    out = eltype(A)[]
    for x in A
        if x ∉ seen
            push!(seen, x)
        else
            push!(out, x)
        end
    end
    out
end
Theme and variations
One minor benefit of analysing data using Julia is that you can try different dates or different repositories. For example, here's a look through the same "lens" at the Images.jl repository, which has been evolving for a few years now, guided chiefly by the amazing Professor Tim Holy. I've not updated it since 2018. (There are way more releases though, with 140 compared with Julia; some tweaking of formats would be necessary to show them all in the same format...)
Running through colorschemes at random is also fun. One of the ones I'm trying out here is called auerbach. It's extracted from a painting by Frank Auerbach, the artist who spreads oil paint very thickly on his canvases (which I suppose might contribute to their million pound price tags).
It's useful to run the same analysis on different sets of data. DatasetA may look like it has every possible permutation and variety of data values, but $(Somebody)'s Law of Data Analysis decrees that as soon as you load DatasetB, you'll find lots of new problems in your methods that DatasetA didn't uncover. (That law needs someone to claim it and name it!)
Since an image for any given dataset at any instant can be produced, it's not too difficult to imagine making a video consisting of snapshots of the data at a series of moments in time, showing how various trends evolve. The problem though is that the design was originally intended for PDF, and it's always easier if you can target a design at a specific format (ask any harassed web designer). Also, the resolution of videos is usually worse than the resolution of PDFs, so the details would be much less easy to read. Even working through the incantations in the Sacred Book of ffmpeg isn't going to make a PDF work well as a video. So only an idiot would try to make a video out of PDFs, and you can view my attempt , which I haven't bothered updating since I made it back in 2018.
And finally...
So here's a message from the name behind one small box on this chart to all the other names in all the other boxes and to all the other contributors who are working elsewhere in the Julia ecosystem: thank you for your efforts, for your refusal to settle for yesterday's state of the art, and for your continuing work towards building the new Julia language!
If you find any egregious errors or omissions that you'd like me to fix, raise an issue on this page's github and I'll look at, and possibly into, it.
[2023-06-25], updating the original from [2018—08-01]
