Rainbow
This post is a simple, beginner level tutorial on how to draw a rainbow using Julia package Luxor.jl.
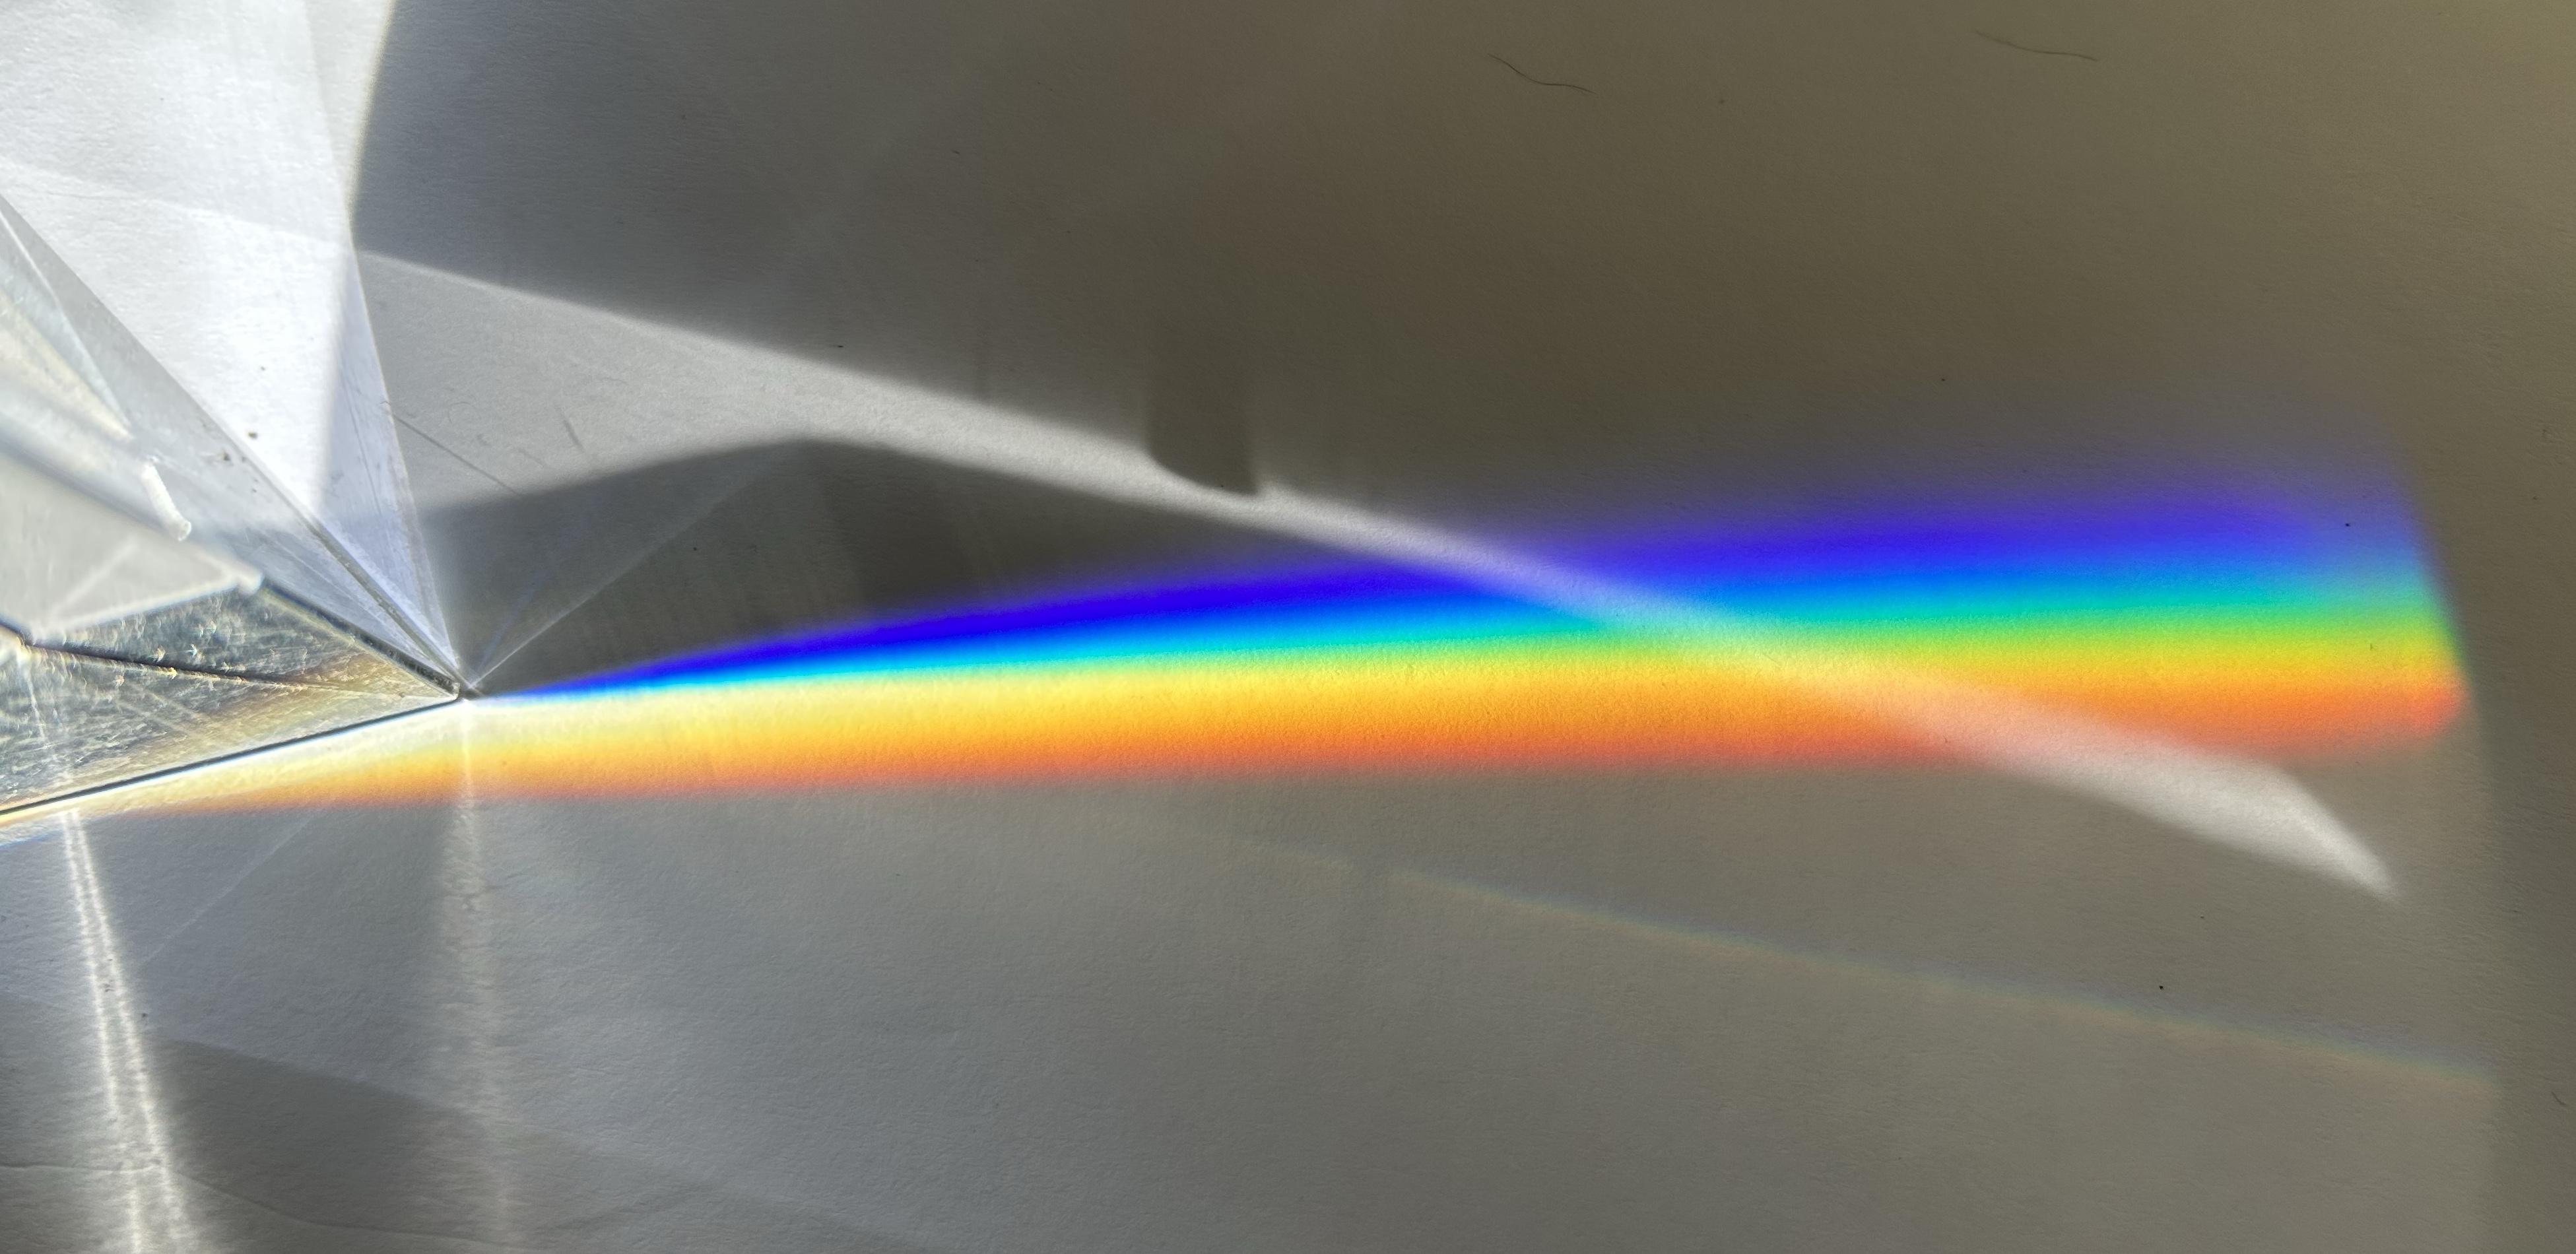
A rainbow is an atmospheric phenomenon where light from the sun is refracted by rain drops into light rays of various colors. It's generally regarded as a Good Thing, although there have been a few exceptions where people are afraid of rainbows (such as the Incas – there might be others).
We'll use the Luxor.jl and Colors.jl packages.
using Luxor, ColorsThe Colors.jl package has lots of colour names defined already, so an easy way to define the set of seven standard colours that make up a rainbow is to put the strings in an array.
rainbow = ["red", "orange", "yellow", "green", "blue", "indigo", "violet"]This is the standard set of seven. Aristotle had said that there were only three colours in a rainbow. Isaac Newton is credited with establishing the canonical set of seven, although his first thought was five colours, before settling on the 'magical' number seven. Here's a picture from Newton's publication called Opticks: or, a Treatise of the Reflexions, Refractions, Inflexions and Colours of Light, which was published in 1704:
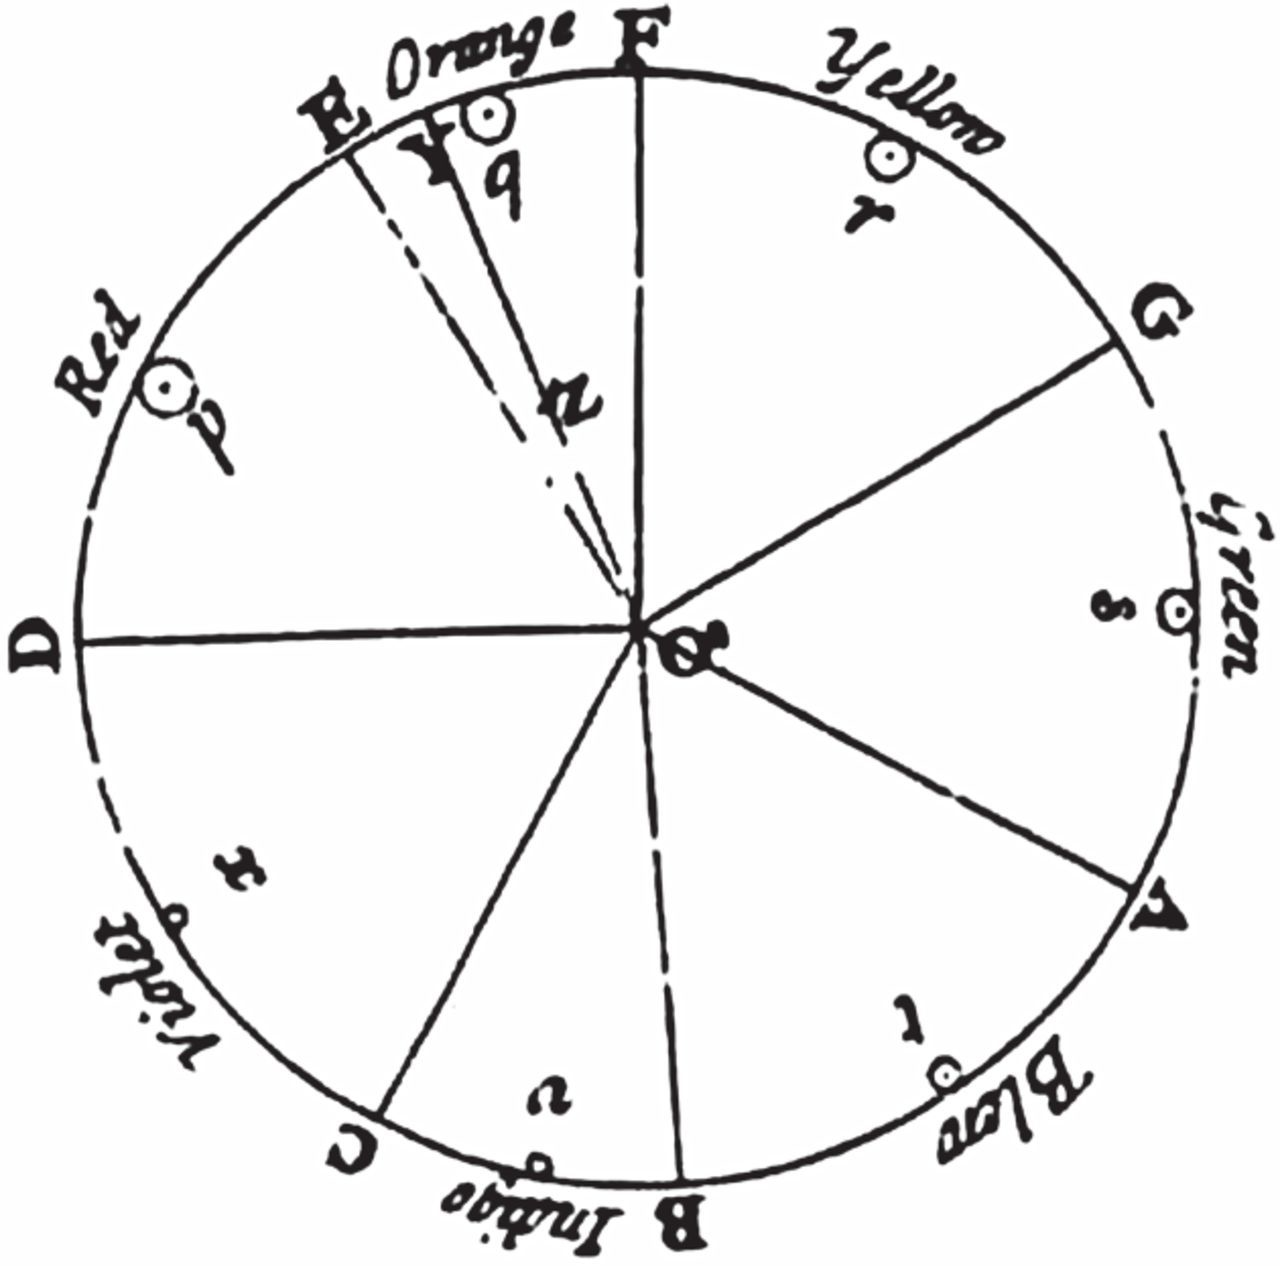
Newton labelled the diagram with the letters D-E-F-G-A-B-C around the edge to show how he thought the colours corresponded with the musical notes of a Dorian scale. It makes no sense to me (and why not a C major scale?), but I think the idea was that the "secondary" colours orange and indigo correspond somehow to the smaller semitone intervals E-F and B-C.
We'll draw seven arcs, one in each colour, with the radius decreasing as we work through the colors. The two angles that specify the start and end of the arcs are π (pointing left, or west, from the center) and 2π or 0) (pointing east, or right, from the center).
band_width determines the thickness of the arc as drawn with arc(), and this value is supplied to setline(). In the loop, the first value of i is 1, so the red arc's radius is outer_radius - (1 * band_width).
outer_radius = 200
band_width = 10
rainbow = ["red", "orange", "yellow", "green", "blue", "indigo", "violet"]
Drawing(800, 600, joinpath(@OUTPUT, "rainbow1.svg")) # *
origin()
background("skyblue")
setline(band_width)

for (i, col) in enumerate(rainbow)
    sethue(col)
    arc(O, outer_radius - (i * band_width), π, 0,  :stroke)
end
finish()
These standard definitions (from the X11/CSS standard list) of "blue", "indigo", and "violet" don't look quite right to my eyes. The blue is very dark for a rainbow, and the indigo isn't quite blue enough, to my eyes. Indigo dye was originally used to dye denim, giving the original 'blue jeans' their distinctive colour, but I've not seen too many pairs of denim jeans with this 'purplish' colour.
Drawing(800, 100, joinpath(@OUTPUT, "indigo.svg"))
origin()
sethue("indigo")
box(O, 800, 60, :fill)
finish()
And this "violet" is a bit too pink, isn't it?
Drawing(800, 100, joinpath(@OUTPUT, "violet.svg"))
origin()
sethue("violet")
box(O, 800, 60, :fill)
finish()
Back to geometry
Instead of drawing thick lines, we can use the sector() function, which can draw a curved circular shape with both outer and inner arcs, suitable for filling and/or stroking. In graphics work it's generally better to use filled shapes rather than stroke widths, because scaling and other tasks are much easier.
Because the red part is drawn first, we'll gradually decrease the inner and outer radius values of each sector by band_width.
background("skyblue")
inner_radius = 180
band_width = 10
for (i, col) in enumerate(rainbow)
    sethue(col)
    sector(O,
        inner_radius,
        inner_radius + band_width * (8 - i),
        π, 2π,  :fill)
end
With filled sectors rather than stroked lines, scaling is simpler:
background("skyblue")
for pt in ngon(O, 200, 8, 0, vertices=true)
    @layer begin
        translate(pt)
        iradius  = 50
        bwidth = 5
        for (i, col) in enumerate(rainbow)
            sethue(col)
            sector(O, iradius, iradius + bwidth * (8 - i), π, 2π, :fill)
        end
    end
end
Let's have a closer look at the colours. Instead of using a list of seven predefined colours, we could calculate the colours using a different colour space, such as HSB - Hue, Saturation, and Brightness, and step through hue values between 0 to 360.
However, the obvious sequence 0-60-120-180-240-300-360 doesn't work for rainbows. Hue doesn't correspond with wavelength. You don't want to both start and finish on red, and the 'distance' from red->orange->yellow->green is 0°-> 90°, whereas from green->blue it's 90° -> 210°. And the hue value for magenta is 300°, but magenta famously does not exist as a colour in the rainbow (it's the brain's response to blue and red combined).
collect(range(0, step = 360/7, length=7))

Drawing(900, 500, joinpath(@OUTPUT, "rainbow4a.svg"))
origin()
background("skyblue")
outer_radius = 200
band_width = 10
hue_steps = (0, 60, 120, 180, 240, 300, 360)
for (i, h) in enumerate(hue_steps)
    sethue(HSB(h, 1, 1))
    sector(O,
        outer_radius - band_width * i,
        outer_radius - band_width * (i - 1),
        π, 2π, :fill)
end
So I'd guess at 0-35-60-125-200-255-275 for some more suitable colours:
collect(range(0, step = 360/7, length=7))

Drawing(900, 500, joinpath(@OUTPUT, "rainbow4.svg"))
origin()
background("skyblue")
outer_radius = 200
band_width = 10
hue_steps = (0, 35, 60, 125, 200, 255, 275)
for (i, h) in enumerate(hue_steps)
    sethue(HSB(h, 1, 1))
    sector(O,
        outer_radius - band_width * i,
        outer_radius - band_width * (i - 1),
        π, 2π, :fill)
end
I think these blue, indigo, and violet bands are better than the named colours, to my eyes, but they're not perfect. And the greens are somewhat off, now. And the orange is getting close to brown, which is a weird colour anyway.
On the right wavelength
So let's look at wavelengths instead.
Colors.jl has a colormatch() function, which accepts a wavelength value (in nanometers). So colormatch(640) returns the colour of light with a wavelength of 640 nm:
Drawing(900, 200, joinpath(@OUTPUT, "colormatch.svg"))
origin()
sethue(colormatch(640))
paint()
finish()
The following example is taken from the Luxor.jl documentation (illustrating tickline()):
function color_temp(n, pos;
          startnumber  = 0,
          finishnumber = 1,
          nticks = 1)
    k = rescale(n, 0, nticks - 1, startnumber, finishnumber)
    sethue(RGB(colormatch(k)))
    circle(pos, 20, action = :fillpreserve)
    sethue("white")
    strokepath()
    text("$(convert(Int, floor(k))) nm", pos - (0, 30), halign=:left, angle=-π/4)
end

Drawing(900, 200, joinpath(@OUTPUT, "colormatch2.svg"))
origin()
background("black")
fontsize(16)
tickline(Point(-350, 0), Point(350, 0),
    startnumber=350,
    finishnumber=750,
    major=15,
    major_tick_function=color_temp)
finish()
This walks through the wavelengths, from shorter, more energetic violet up to longer, less energetic red. The colormatch() function returns a suitable RGB colour, and "black" when outside the range of visible light wavelengths.

So we can draw a rainbow where the outer band corresponds to light with the wavelength of red – let's guess at an approximate value of 640 nm – and with an inner band of 420 nm for the violet.
Drawing(900, 500, joinpath(@OUTPUT, "rainbow5.svg"))
origin()
background("skyblue")
outer_radius = 200
band_width = 10
for i in 1:7
    colortemp = rescale(i, 1, 7, 640, 420) # nanometers
    sethue(colormatch(colortemp))
    sector(O,
        outer_radius - band_width * i,
        outer_radius - band_width * (i - 1),
        π, 2π, :fill)
end
Perhaps, apart from the blue/violet, this is the best attempt so far.
Colour vision and perception, and the intriguing geometry of rainbows, are fascinating topics, well worth investigating.
Raindrops
Weather forecasters often talk about bands of rain, but these drawings using bands of colour are obviously simplifications – the colours in a rainbow change slowly and gradually rather than in jumps, and mix together too ("spectral smearing").
Perhaps we can emulate this using colour blends or gradients. A simple radial blend can be built from two points, two radii, and two colours. In this simple example, the two points are the origin, the two radii are 50 and 150, and the two colours are "red" and "blue".
Drawing(800, 400, joinpath(@OUTPUT, "blend.svg"))
background("black")
origin()
setblend(blend(Point(0, 0), 50, Point(0, 0), 150, "red", "blue"))
sector(O, 50, 150, 0, 2π, :fill)
finish()
So we can calculate the outer and inner wavelengths for each of the seven bands and draw continuous colour blends rather than coloured bands.
Drawing(800, 500, joinpath(@OUTPUT, "blend2.svg"))
origin()
background("skyblue")
outer_radius = 200
band_width = 10
max_wavelength = 640 # reddish in nanometers
min_wavelength = 420 # violetish in nanometers
for i in 1:7
    outercolorwavelength = rescale(i, 1, 8, max_wavelength, min_wavelength)
    outercol = colormatch(outercolorwavelength)
    innercolorwavelength = rescale(i + 1, 1, 8, max_wavelength, min_wavelength)
    innercol = colormatch(innercolorwavelength)

    o_radius = outer_radius - (band_width * i)
    i_radius = outer_radius - (band_width * (i + 1))

    setblend(blend(O, i_radius, O, o_radius, innercol, outercol))

    sector(O,
        i_radius,
        o_radius,
        π, 2π, :fillstroke)
end
finish()
Raindrops
That blend is a bit garish. It would be nice if we could just kind of draw drops of water and make them show colours.
Here's an idea. Draw lots of small dots. The colour of each dot is controlled by the distance from the drop to the center. Outside the minimum and maximum wavelengths of visible light, colormatch() returns black so don't draw them.
max_wavelength = 640 # reddish in nanometers
min_wavelength = 420 # violetish in nanometers
Drawing(900, 500, joinpath(@OUTPUT, "rain.svg"))
origin()
background("skyblue")
drops = randompointarray(BoundingBox(), 1.25)
for pt in drops
    pt.y > 0 && continue
    d = distance(O, pt) + rand(-10:10)
    wavelength = rescale(d, 180, 250, min_wavelength, max_wavelength)
    if !(max_wavelength > wavelength > min_wavelength)
        continue
    end
    sethue(colormatch(wavelength))
    rect(pt, 1, 1, :fill)
end
finish()
A bit of randomness doesn't hurt.
With a few tweaks we can make the inside of the rainbow look lighter than the outside:
img = readpng("./_assets/images/rainbow/hp.png")
# Houses of Parliament image by Andrea Abbott

max_wavelength = 640 # reddish in nanometers
min_wavelength = 420 # violetish in nanometers

Drawing(1024, 669, joinpath(@OUTPUT, "parliament.png"))
origin()
background("skyblue")
placeimage(img, centered=true)
pts = randompointarray(BoundingBox(), 1)

for pt in pts
    pt.y > -50 && continue
    setopacity(rescale(pt.y, -350, -50, 0.9, 0))
    d = distance(O + (100, 0), pt) + rand(-10:10)
    wavelength = rescale(d, 300, 330, min_wavelength, max_wavelength)
    if wavelength < min_wavelength
        setopacity(0.1)
        sethue("white")
    elseif wavelength > max_wavelength
        setopacity(0.1)
        sethue("black")
    else
        sethue(colormatch(wavelength))
    end
    rect(pt, 1, 1, :fill)
end
finish()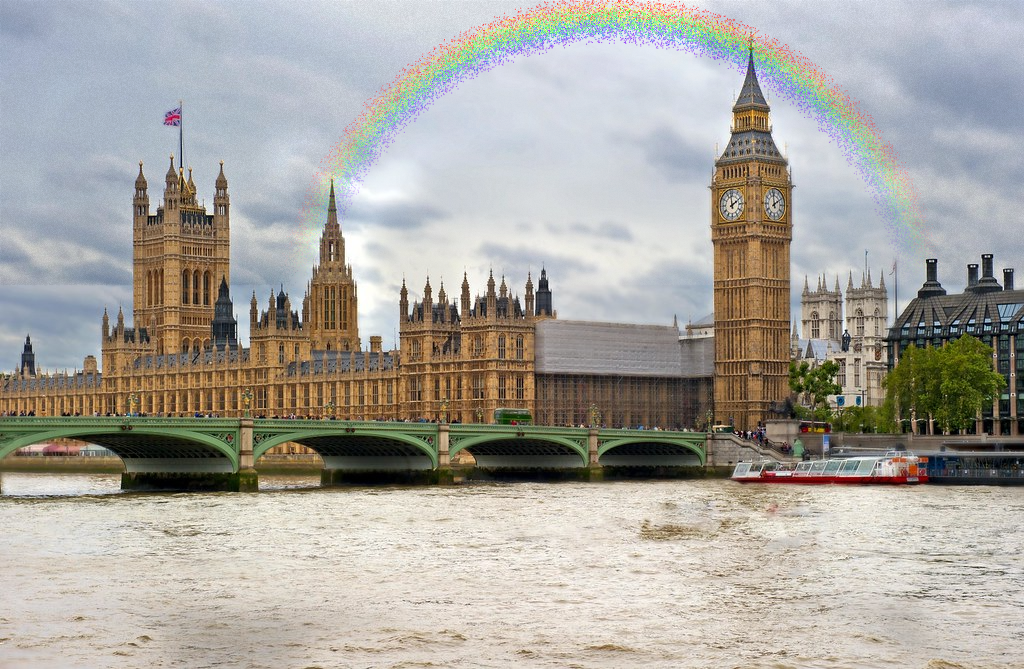
It would be fun to do more precise modelling of this using some ray-tracing software, such as Makie.jl or Blender.
Flagged
In 2016, the rainbow pride flag was flown above the UK Houses of Parliament for London Pride Weekend (24-26 June), the first time the rainbow flag had been flown from Parliament.
The "rainbow" pride flag has only 6 colours, and the three "blue", "indigo", and "violet" bands have been replaced with just two colours. The original rainbow pride flag, designed by Gilbert Baker in 1978, had eight colours, with "pink" at the top, but pink cloth was hard to find, and the six coloured flags were easier to make.
By the way, drawing a six colour flag is even easier than drawing a rainbow. Here I've gone for the named colors "blue" and "purple" for the last two.
w = 1000
h = 600
Drawing(w, h, joinpath(@OUTPUT, "pride.svg"))
origin()
boxes = Tiler(w, h, 6, 1, margin=0)
pride_colors = ["red", "orange", "yellow", "green", "blue", "purple"]
for (i, bx) in enumerate(boxes)
    sethue(pride_colors[i])
    box(boxes, i, :fillstroke)
end
finish()
with this result:

May 17th is the International Day Against Homophobia, Biphobia and Transphobia, a day to celebrate diversity and to raise awareness of the human rights of lesbian, gay, bisexual, transgender, and intersex (LGBTIQ+) people.
So, draw a rainbow - or a rainbow flag - today!
[2023-05-17]
