Polygons and planes
The pin() function accepts an array of 3D points as well as singletons and pairs. In this case, the default graphical treatment is to apply the Luxor.poly(... :stroke) function to the array of projected 2D points.
Möbius
function makemobius()
    x(u, v) = (1 + (v / 2 * cos(u / 2))) * cos(u)
    y(u, v) = (1 + (v / 2 * cos(u / 2))) * sin(u)
    z(u, v) = v / 2 * sin(u / 2)
    w = 1
    st = 2π / 150
    Δ = 0.1
    result = Array{Point3D,1}[]
    for u in 0:st:2π-st
        for v in -w:Δ:w
            p1 = Point3D(
                x(u, v + Δ / 2),
                y(u, v + Δ / 2),
                z(u, v + Δ / 2))
            p2 = Point3D(
                x(u + st, v + Δ / 2),
                y(u + st, v + Δ / 2),
                z(u + st, v + Δ / 2))
            p3 = Point3D(
                x(u + st, v - Δ / 2),
                y(u + st, v - Δ / 2),
                z(u + st, v - Δ / 2))
            p4 = Point3D(
                x(u, v - Δ / 2),
                y(u, v - Δ / 2),
                z(u, v - Δ / 2))
            push!(result, [p1, p2, p3, p4])
        end
    end
    return result # as an array of 3D polygons
end

# ... on a drawing
@drawsvg begin
    background("grey20")
    eyepoint(300, 300, 300)
    perspective(1200)
    setopacity(0.7)
    sethue("white")
    setline(0.4)
    mb = makemobius()
    for pgon in mb
        pin(100pgon)
    end
end 800 600
This isn’t always going to be correct - although three 3D points always define a flat face in a 2D plane, more than three points don’t always do so.
The default action when pin() is called on a list of Point3Ds is poly(pts, fill), once the Point3Ds have been projected into 2D space as pts.
You can also pass a gfunction. It should accept two arguments: a list of Point3Ds and a list of Points. For example, this calls Luxor's poly() function on the list of 2D points in p2 that are the projections of the Point3Ds in pgon.
pin(pgon,
    gfunction = (p3list, p2list) -> begin
        poly(p2list, close=true, :fill)
    end)
In this example, the gfunction draws colored circles inside each square:
function makemobius()
    x(u, v) = (1 + (v / 2 * cos(u / 2))) * cos(u)
    y(u, v) = (1 + (v / 2 * cos(u / 2))) * sin(u)
    z(u, v) = v / 2 * sin(u / 2)
    w = 1
    st = 2π / 160
    Δ = 0.1
    result = Array{Point3D,1}[]
    for u in 0:st:2π-st
        for v in -w:Δ:w
            p1 = Point3D(
                x(u, v + Δ / 2),
                y(u, v + Δ / 2),
                z(u, v + Δ / 2))
            p2 = Point3D(
                x(u + st, v + Δ / 2),
                y(u + st, v + Δ / 2),
                z(u + st, v + Δ / 2))
            p3 = Point3D(
                x(u + st, v - Δ / 2),
                y(u + st, v - Δ / 2),
                z(u + st, v - Δ / 2))
            p4 = Point3D(
                x(u, v - Δ / 2),
                y(u, v - Δ / 2),
                z(u, v - Δ / 2))
            push!(result, [p1, p2, p3, p4])
        end
    end
    return result # as an array of 3D polygons
end

# ... in a drawing
@drawsvg begin
    background("grey20")
    eyepoint(300, 300, 300)
    perspective(1200)
    mb = makemobius()
    for (n, pgon) in enumerate(mb)
        pin(100pgon,
        gfunction = (p3list, p2list) -> begin
                sethue(HSB(rand(200:300), 0.7, 0.8))
                ellipseinquad(p2list, action=:fill)
            end)
    end
end 800 600
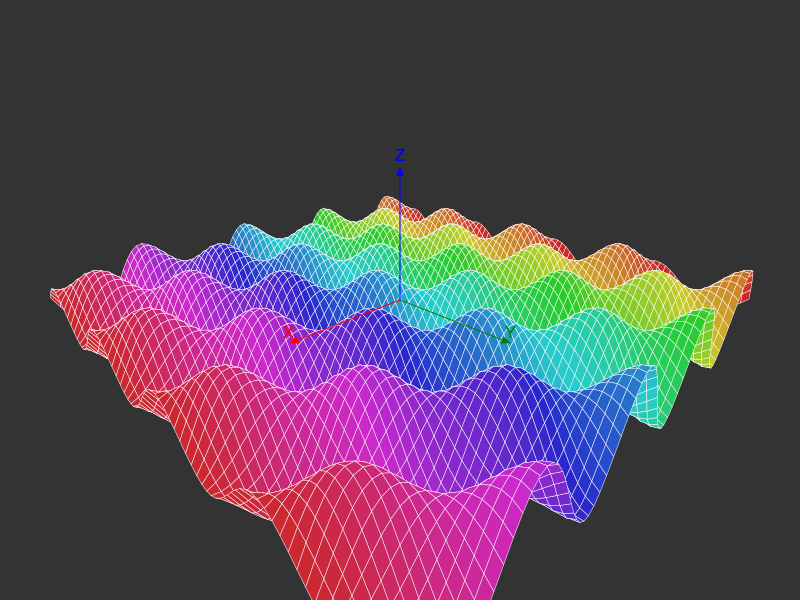
Surfaces
A surface plot like the following also works quite well, mainly because each new polygon hides the ones behind it.
@draw begin
    background("grey20")

    perspective(500)
    eyepoint(500, 500, 300)

    k = 30
    xmax = 4π
    ymax = 4π
    st = 0.3

    f(x, y) = 2(sin(x) * cos(y)) + (cos(x) * sin(y))

    sethue("blue")
    setline(0.5)

    for x in -xmax:st:xmax
        for y in -ymax:st:ymax
            sethue(HSB(360rescale(x, -xmax, xmax), 0.8, 0.8))
            p1 = Point3D(k * x,
                k * y,
                k * f(x, y))
            p2 = Point3D(k * x,
                k * (y + st),
                k * f(x, y + st))
            p3 = Point3D(k * (x + st),
                k * (y + st),
                k * f(x + st, y + st))
            p4 = Point3D(k * (x + st),
                k * y,
                k * f(x + st, y))
            pin([p1, p2, p3, p4], gfunction=(p3s, p2s) -> begin
                poly(p2s, close=true, :fill)
                sethue("white")
                poly(p2s, close=true, :stroke)
            end)
        end
    end

    axes3D(200)
end 800 600