Syntax
Overview
Karnak's function for drawing graphs is drawgraph(). This takes a single argument, a Graph, and tries to place representative graphics on the current Luxor drawing.
The default display for graphs is:
current Luxor origin, scale and rotation
current Luxor color for edges
circles for all vertex shapes
no vertex labels
all edges drawn
@drawsvg begin
    background("grey10")
    sethue("darkcyan")
    g = complete_graph(10)
    drawgraph(g)
end 600 300
To control the appearance of the graph, you supply values to the various keyword arguments. Apart from the general keywords BoundingBox, layout, and margin, the keywords can be grouped into two categories:

Most of these keyword arguments accept vectors, ranges, and scalar values, and some accept functions as well.
Here's a contrived (and consequently hideously ugly) example of the type of syntax available:
@drawsvg begin
background("grey10")
sethue("purple")
g = smallgraph(:karate)
drawgraph(g, layout=stress,
    vertexshapes = [:square, :circle],
    vertexfillcolors = (v) -> v ∈ (1, 3, 6) ? colorant"red" : colorant"grey40",
    vertexstrokecolors = colorant"orange",
    vertexstrokeweights = range(0.5, 4, length=nv(g)),
    vertexshapesizes = 2 .* [Graphs.outdegree(g, v) for v in Graphs.vertices(g)],
    vertexlabelfontsizes = 2 .* [Graphs.outdegree(g, v) for v in Graphs.vertices(g)],
    vertexlabels = 1:nv(g),
    vertexlabelrotations = π/8,
    vertexlabeltextcolors = distinguishable_colors(10)
)
end 600 300
Here, the outdegree for each vertex (the number of edges leaving it) is used to control the size of the vertices and the font sizes too. vertexshapes flip-flops between squares and circles for each vertex shape, but the size of the shape is determined by a vertexshapesizes function, which receives a Vector of sizes, the outdegree values for each vertex. The font sizes of the labels are also set this way. A vertexfillcolors function lets you determine the shape's fill color for specific vertices, whereas the stroke color is always orange, with stroke weights gradually increasing. The colors of the labels are set by the Colors.distinguishable_colors() function passed to vertexlabeltextcolors. And all the labels are rotated, for no particularly good reason.
Usually, if a vector runs out before the vertices and edges have been drawn, some mod1 magic means the values repeat from the beginning again.
Use drawgraph() more than once, if needed, to build up the graph in layers. Remember to use the same layout algorithm.
Summary of keywords
| boundingbox | BoundingBox | drawing will fit inside this bounding box |
| margin | Number | margin in points/pixels |
| layout | Vector{Point} | list of coordinates of each vertex |
| function from NetworkLayout.jl | squaregrid, shell, stress, etc | |
| f(g::Graph) | (g) -> spectral(adjacency_matrix(g), dim=2) | |
| edgefunction | f(edgenumber::Int, edgesrc::Int, edgedest::Int, from::Point, to::Point) | function that completely specifies the appearance of every edge. If present, none of the other edge- keyword arguments are used. |
| vertexfunction | f(vtx::Int, coordinates::Vector{Point}) | function that completely specifies the appearance of every vertex. If present, None of the other vertex- keyword arguments will be used. |
| edgecurvature | Float64 | curviness of edge arrows |
| edgearrows | Boolean | draw destination arrows for directed graphs only |
| Vector{Boolean} | ||
| f(edgenumber, edgesrc, edgedest, from::Point, to::Point) | function to draw arrows for directed graphs only | |
| edgedashpatterns | Vector{Vector}[number] | vector of dash patterns |
| Vector{Number} | a dash pattern | |
| edgegaps | Vector | gaps from each vertex center to arrow tip |
| Range | ||
| Real | gaps from every vertex center to arrow tip | |
| f(edgenumber, edgesrc, edgedest, from::Point, to::Point) | gaps from every vertex center to arrow tip | |
| edgelabelcolors | Vector{Colorant} | colors of each vertex's label text |
| Colorant | color of all vertex labels | |
| edgelabelfontfaces | Vector{Strings}[edgenumber] | font face for each edge |
| String | font face for every edge | |
| :none | ||
| edgelabelfontsizes | Vector{Number} | the font size of each edge label |
| Number | the font size of every edge label | |
| edgelabelrotations | Vector{angles} | rotation of each label |
| angle::Float64 | rotation of every label | |
| f(edgenumber, edges, edgedest, from, to) | function returns angle for this edge | |
| edgelabels | Vector | |
| range | ||
| Dict{Int, Int} | (src, dst) => "labeltext" | |
| f(edgenumber, edgesrc, edgedest, from::Point, to::Point) | ||
| :none | ||
| edgelines | Vector{Int} | numbers of edges to be drawn |
| range | ||
| Int | ||
| f(edgenumber, edgesrc, edgedest, from::Point, to::Point) | ||
| edgelist | Graphs.EdgeIterator | the edges to be drawn - takes prioity over edgelines |
| edgestrokecolors | Vector{Colorant}[edge::Int] | colors for edges |
| Colorant | color for every edge | |
| f(edgenumber, edgesrc, edgedest, from::Point, to::Point) | function to set color for this edge | |
| edgestrokeweights | Vector{Number}[vtx] | |
| range | ||
| Real | ||
| f(edgenumber, edgesrc, edgedest, from::Point, to::Point) | function that returns a value for line width | |
| vertexfillcolors | Vector{Colorant} | |
| Colorant | ||
| :none | ||
| f(vtx::Int) | ||
| vertexlabelfontfaces | Vector{Strings} | font face for each vertex |
| String | font face for every vertex | |
| vertexlabelfontsizes | Vector | |
| range | ||
| Real | ||
| :none | ||
| f(vtx::Int, coords::Point[]) | function returns the fontsize for this label | |
| vertexlabeloffsetangles | Vector | |
| Range | ||
| Real | ||
| vertexlabeloffsetdistances | Vector | |
| range | ||
| Real | ||
| vertexlabelrotations | Vector | |
| range | ||
| Real | ||
| :none | ||
| vertexlabels | Vector{String} | cycles |
| String | used for all vertices | |
| range[vtx::Int] | string of the number in the range, cycles | |
| :none | ||
| f(vtx::Int) | function returns a string for the vertex label | |
| vertexlabeltextcolors | Vector{Colorant} | color for each text label |
| Colorant | color of all text labels | |
| :none | ||
| f(vtx::Int) | function returning a colorant | |
| vertexshaperotations | f(vtx::Int) | |
| angle::Float64 | ||
| vertexshapes | Vector of :circle :square :none | shapes of each vertex |
| range[vtx] | draw default shape at this vertex | |
| :circle :square :none | shape of every vertex | |
| f(vtx::Int) | function draws shape at this vertex (which is Point(0, 0)) | |
| vertexshapesizes | Vector{Real} | |
| range | ||
| Real | ||
| :none | ||
| f(vtx::Int) | ||
| vertexstrokecolors | Vector | |
| Colorant | ||
| :none | ||
| f(vtx::Int) | ||
| vertexstrokeweights | Vector | |
| range | ||
| :none |
The BoundingBox
The graphics for the graph are placed to fit inside the current BoundingBox (by default, the drawing), after allowing for the margin (the default is 30). Pass a different BoundingBox to the boundingbox keyword argument to control the graph layout's size.
Layout algorithms
The only clever part of this package is provided by NetworkLayout.jl), which is where you should look for information about the various algorithms that determine where vertices are positioned.
You can choose a layout algorithm, or supply the vertex positions yourself.
The main layout algorithms available are:
shell
spring
stress
squaregrid
Here are some formulations which work as keywords in drawgraph():
layout = squaregrid

layout = shell

layout = stress

layout = spectral

layout = (g) -> spectral(adjacency_matrix(g), dim=2)

layout = shell ∘ adjacency_matrix

layout = (g) -> sfdp(g, Ptype=Float64, dim=2, tol=0.05, C=0.4, K=2)

layout = Shell(nlist=[6:10,])

layout = Stress(iterations = 100, weights = M) # M is matrix of weights

layout = Spring(iterations = 200, initialtemp = 2.5)
Alternatively, you can pass a vector of points to the layout keyword argument. Vertices will be placed on these points (vertex 1 on point 1, etc...), rather than at points suggested by the NetworkLayout algorithms. For example, in this next drawing, the two sets of points for a bipartite graph are generated beforehand.
@drawsvg begin
background("grey10")
N = 12; H = 250; W = 550
g = complete_bipartite_graph(N, N)
pts = vcat(
    [between(O + (-W / 2, -H / 2), O + (-W / 2, H / 2), i) for i in range(0, 1, length=N)], # left
    [between(O + (W / 2, H / 2), O + (W / 2, -H / 2), i) for i in range(0, 1, length=N)] # right
    )
circle.(pts, 1, :fill)
drawgraph(g, vertexlabels = 1:nv(g), layout = pts,
    edgestrokeweights = 0.5,
    edgestrokecolors = (n, f, t, s, d) -> HSB(rescale(n, 1, ne(g), 0, 360), 0.6, 0.9))
end 600 300
The calculated positions are returned by the drawgraph() function.
Initial positions for the layout algorithms
Some of the layout algorithms - the Spring and Stress ones, for example - allow you to pass initial vertex positions to be used by the algorithms as starting points. The algorithm will continually adjust them to make a better result. These initial positions should be supplied as xy pairs, rather than Points (which NetworkLayout doesn't know about).
Here's an animation showing how the Stress algorithm gradually improves the layout on each iteration. The initial positions are just the "grid locations" of a Tiler iterator.
using Karnak, Graphs, NetworkLayout, Colors

function frame(scene, framenumber, G)

    background("black")
    initialpositions = [(pt.x, pt.y) for (pt, n) in Tiler(600, 600, 3, 3)]

    sethue("grey50")
    circle.(Point.(initialpositions), 3, :fill)

    for i in 1:framenumber
        setopacity(rescale(i, 1, scene.framerange.stop, 0, 0.6))
        drawgraph(G,
            layout=Stress(initialpos=initialpositions, iterations=i),
            vertexfillcolors=(i == framenumber) ? colorant"gold" : :none
        )
    end

end

function main()
    G = smallgraph(:petersen)
    amovie = Movie(600, 600, "layout")
    animate(amovie,
        Scene(amovie, (s, f) -> frame(s, f, G), 1:60),
        framerate=10, creategif=true)
end

main()
The vertexfunction and edgefunction arguments
The two keyword arguments vertexfunction and edgefunction allow you to pass control over the drawing process completely to these two functions.
vertexfunction = my_vertexfunction(vertex, coordinates)
edgefunction = my_edgefunction(edgenumber, edgesrc, edgedest, from::Point, to::Point)
These allow you to draw graphics for the vertex vertex at the point coordinates[vertex], and to draw graphics for each edge edgenumber joining from from to to.
The arguments passed to a vertexfunction keyword are the current vertex number and an array of all vertex coordinates.
g = wheel_graph(30)
@drawsvg begin
    background("grey10")
    sethue("gold")
    drawgraph(g,
        edgelines = [],
        vertexfunction=(v, c) -> begin
            @layer begin
                sethue(HSB(rescale(v, 1, nv(g), 0, 360), 0.7, 0.8))
                translate(c[v])
                circle(O, 5, :fill)
            end
        end,
    )
end 800 200
The graphics can be any arbitrary Luxor graphics functions. In the following picture, the vertex positions were passed to a function that placed clipped PNG images on the drawing (using readpng() and placeimage()), and the edges were drawn using sine curves. Refer to the Luxor.jl documentation for more about putting colored things on drawings.
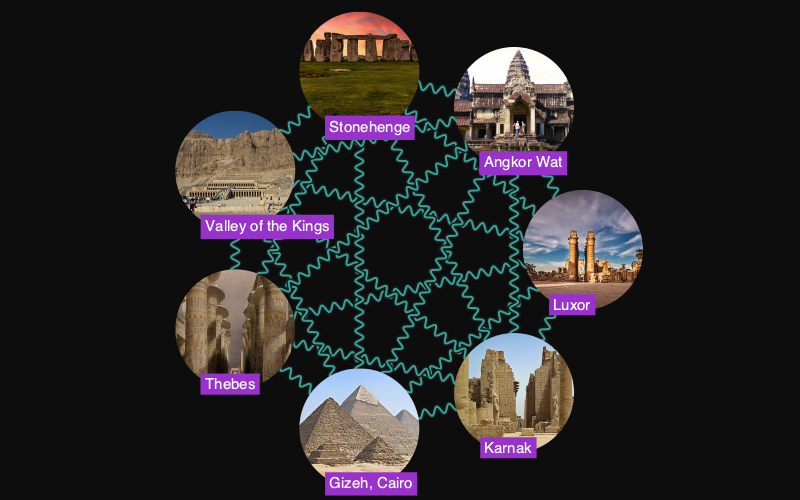
It's also possible, for example, to draw another graph at each vertex point (ie recursive graph drawing) if you use vertexfunction.
g = complete_graph(5)

function rgraph(g, l=1)
    if l > 4
        return
    else
        drawgraph(g,
            layout=stress,
            boundingbox=BoundingBox() / 2l,
            vertexfunction=(v, c) -> begin
                @layer begin
                    sethue(HSB(rescale(v, 1, 4, 0, 360), 0.7, 0.8))
                    translate(c[v])
                    #circle(c[v], 5, :fill)
                    rgraph(g, l + 1)
                end
            end,
            )
    end
end

@drawsvg begin
    background("grey10")
    sethue("gold")
    rgraph(g)
end 800 600
The arguments passed to a edgefunction keyword are the edge number, source vertex number, destination vertex number, from coordinate, and to coordinate.
fstroke(x, θ) = begin
    0.5 + 20sin(x * π)
end
g = complete_graph(4)
@drawsvg begin
    background("grey10")
    sethue("gold")
    border = box(BoundingBox())
    drawgraph(g,
        vertexshapes=:none,
        edgefunction=(n, s, d, f, t) -> begin
            sethue(HSL(60n, 0.9, 0.6))
            poly(offsetpoly(
                    polysample([f, t], include_first=true, closed=false, 30),
                    fstroke), :fill)
        end,
    )
end 800 400
Functions as keyword arguments
The following keyword arguments accept functions:
edgelabelrotationsedgelabelsedgelinesedgestrokecolorsedgestrokeweightsvertexfillcolorsvertexlabelsvertexlabeltextcolorsvertexshaperotationsvertexshapesvertexshapesizesvertexstrokecolorsvertexstrokeweights
The edge- keywords accept functions with arguments (edgenumber, sourcevertex, destinationvertex, frompoint, topoint). The vertex- keywords accept functions with arguments (vertex).
These functions aren't used if you supply functions to vertexfunction or edgefunction.
Vertex labels and shapes
vertexlabels
Use vertexlabels to choose the text to associate with each vertex. Supply a range, array of strings or numbers, a single string, or a function.
This example draws all vertices, and numbers them from 1 to 6.
In Graphs.jl, vertices are always numbered from 1 to n. If you remove a vertex, vertices are effectively re-numbered.
@drawsvg begin
    background("grey10")
    g = smallgraph(:octahedral)
    sethue("gold")
    drawgraph(g, layout=stress,
        vertexlabels = 1:nv(g),
        vertexshapesizes = 10)
end 600 300
A function can be passed to vertexlabels to display a vertex; it should accept a single numerical argument, the vertex number, and return a string to display. Labelling all of them isn't always necessary.
@drawsvg begin
background("grey10")
g = smallgraph(:octahedral)
sethue("skyblue")
drawgraph(g, layout=stress,
    vertexlabels = (v) -> v ∈ (1, 4, 6) && string(v, "/6"),
    vertexshapesizes = 15,
    vertexlabelfontsizes = 20,
    )
end 600 300
Using LaTex in labels
If you want to use $\LaTeX$ in vertex labels, you can load MathTeXEngine.jl to parse the LaTeXStrings. Make sure the fonts in the MathTexEngine package are also available to the Operating System's font routines (so copying them to your local font folder is probably required).
using Karnak, Graphs, NetworkLayout, Colors
using MathTeXEngine, LaTeXStrings

g = complete_graph(4)
@svg begin
    background("grey10")
    sethue("cyan")
    fontsize(40)
    drawgraph(g,
        margin=30,
        vertexlabels = [L"v_%$(x)" for x in 1:nv(g)],
        vertexlabeloffsetdistances = [40, 40, -40, 40],
        vertexlabeltextcolors = colorant"white"
    )
end 600 300
vertexshapes and vertexshapesizes
The default shape for a vertex is a filled circle.
Options for vertexshapes are :circle and :square. With just two in a vector, they will be used alternately.
@drawsvg begin
background("grey10")
g = smallgraph(:moebiuskantor)
sethue("gold")
drawgraph(g, layout=shell, vertexshapes = [:square, :circle])
end 600 300
vertexshapesizes can set the sizes for the built-in vertex shapes.
@drawsvg begin
background("grey10")
g = smallgraph(:moebiuskantor)
sethue("gold")
drawgraph(g, layout=shell,
    vertexshapes = [:square, :circle],
    vertexshapesizes = [15, 5])
end 600 300
@drawsvg begin
background("grey10")
g = smallgraph(:moebiuskantor)
sethue("gold")
drawgraph(g, layout=shell,
    vertexshapesizes = (v) -> rescale(v, 1, nv(g), 5, 25))
end 600 300
vertexshaperotations can set the rotations.
@drawsvg begin
background("grey10")
g = smallgraph(:moebiuskantor)
sethue("gold")
drawgraph(g, layout=shell,
    vertexshapes = :square,
    vertexshapesizes = [10, 20, 5],
    vertexshaperotations = [π/2, π/3],
    )
end 600 300
To show every other vertex and label, you could use something like this:
@drawsvg begin
background("grey10")
g = smallgraph(:truncatedcube)
sethue("darkturquoise")
drawgraph(g, layout=stress,
    vertexlabels = ["1", ""],
    vertexshapesizes = [10, 0])
end 600 300
When circles and squares don't cut it, supply a function to vertexshapes. The single argument is the vertex number; any graphics you draw will be centered at the vertex location, the current origin, Point(0, 0).
@drawsvg begin
background("grey10")
g = smallgraph(:moebiuskantor)
sethue("hotpink")
drawgraph(g, layout=shell,
    vertexshapes = (v) -> star(O, 15, v+2, 0.5, 0, :fill))
end 600 300
Here, the vertex number is hinted at by the number of points on each star.
In the next example, the sizes of the labels and shapes are determined by the degree of each vertex, supplied in a vector.
@drawsvg begin
background("grey10")
g = smallgraph(:karate)
sethue("slateblue")
drawgraph(g, layout=stress,
    vertexlabels = 1:nv(g),
    vertexlabelfontsizes = [Graphs.outdegree(g, v) for v in Graphs.vertices(g)],
    vertexshapesizes = [Graphs.outdegree(g, v) for v in Graphs.vertices(g)],
    vertexfillcolors = (v) -> v ∈ (1, 3, 6) && colorant"red",
    )
end 600 300
One more example with vertexshapes.
function whiten(col::Color, f=0.5)
    hsl = convert(HSL, col)
    h, s, l = hsl.h, hsl.s, hsl.l
    return convert(RGB, HSL(h, s, f))
end

function drawball(pos, ballradius, col::Color;
        fromlum=0.2,
        tolum=1.0)
    gsave()
    translate(pos)
    for i in ballradius:-0.25:1
        sethue(whiten(col, rescale(i, ballradius, 0.5, fromlum, tolum)))
        offset = rescale(i, ballradius, 0.5, 0, -ballradius/2)
        circle(O + (offset, offset), i, :fill)
    end
    grestore()
end

@drawsvg begin
background("grey10")
g = clique_graph(5, 6)
sethue("yellow")
setline(0.2)
drawgraph(g,
    layout = stress,
    vertexshapes = (v) -> drawball(O, 25, RGB([Karnak.Luxor.julia_red,Karnak.Luxor.julia_purple, Karnak.Luxor.julia_green][rand(1:end)]...))
)
end 600 600
vertexstrokecolors and vertexfillcolors
These keywords accept a Colors.jl colorant, an array of them, or a function that generates a color.
@drawsvg begin
background("grey10")
g = smallgraph(:cubical)
sethue("darkorange")
drawgraph(g, layout=stress,
    vertexshapes = :square,
    vertexshapesizes =  20,
    vertexfillcolors = [colorant"red", colorant"blue"],
    vertexstrokecolors = [colorant"blue", colorant"red"])
end 600 300" fill-opacity="1"/>
<path fill="none" stroke-width="1" stroke-linecap="butt" stroke-linejoin="miter" stroke="rgb(100%25, 54.901961%25, 0%25)" stroke-opacity="1" stroke-miterlimit="10" d="M 300.21875 124.605469 L 247.871094 270 "/>
<path fill="none" stroke-width="1" stroke-linecap="butt" stroke-linejoin="miter" stroke="rgb(100%25, 54.901961%25, 0%25)" stroke-opacity="1" stroke-miterlimit="10" d="M 300.21875 124.605469 L 212.394531 34.667969 "/>
<path fill="none" stroke-width="1" stroke-linecap="butt" stroke-linejoin="miter" stroke="rgb(100%25, 54.901961%25, 0%25)" stroke-opacity="1" stroke-miterlimit="10" d="M 300.21875 124.605469 L 438.167969 132.480469 "/>
<path fill="none" stroke-width="1" stroke-linecap="butt" stroke-linejoin="miter" stroke="rgb(100%25, 54.901961%25, 0%25)" stroke-opacity="1" stroke-miterlimit="10" d="M 247.871094 270 L 161.832031 168.160156 "/>
<path fill="none" stroke-width="1" stroke-linecap="butt" stroke-linejoin="miter" stroke="rgb(100%25, 54.901961%25, 0%25)" stroke-opacity="1" stroke-miterlimit="10" d="M 247.871094 270 L 387.191406 265.839844 "/>
<path fill="none" stroke-width="1" stroke-linecap="butt" stroke-linejoin="miter" stroke="rgb(100%25, 54.901961%25, 0%25)" stroke-opacity="1" stroke-miterlimit="10" d="M 161.832031 168.160156 L 212.394531 34.667969 "/>
<path fill="none" stroke-width="1" stroke-linecap="butt" stroke-linejoin="miter" stroke="rgb(100%25, 54.901961%25, 0%25)" stroke-opacity="1" stroke-miterlimit="10" d="M 161.832031 168.160156 L 299.972656 175.066406 "/>
<path fill="none" stroke-width="1" stroke-linecap="butt" stroke-linejoin="miter" stroke="rgb(100%25, 54.901961%25, 0%25)" stroke-opacity="1" stroke-miterlimit="10" d="M 212.394531 34.667969 L 352.191406 30 "/>
<path fill="none" stroke-width="1" stroke-linecap="butt" stroke-linejoin="miter" stroke="rgb(100%25, 54.901961%25, 0%25)" stroke-opacity="1" stroke-miterlimit="10" d="M 438.167969 132.480469 L 352.191406 30 "/>
<path fill="none" stroke-width="1" stroke-linecap="butt" stroke-linejoin="miter" stroke="rgb(100%25, 54.901961%25, 0%25)" stroke-opacity="1" stroke-miterlimit="10" d="M 438.167969 132.480469 L 387.191406 265.839844 "/>
<path fill="none" stroke-width="1" stroke-linecap="butt" stroke-linejoin="miter" stroke="rgb(100%25, 54.901961%25, 0%25)" stroke-opacity="1" stroke-miterlimit="10" d="M 352.191406 30 L 299.972656 175.066406 "/>
<path fill="none" stroke-width="1" stroke-linecap="butt" stroke-linejoin="miter" stroke="rgb(100%25, 54.901961%25, 0%25)" stroke-opacity="1" stroke-miterlimit="10" d="M 299.972656 175.066406 L 387.191406 265.839844 "/>
<path fill-rule="nonzero" fill="rgb(100%25, 0%25, 0%25)" fill-opacity="1" stroke-width="1" stroke-linecap="butt" stroke-linejoin="miter" stroke="rgb(0%25, 0%25, 100%25)" stroke-opacity="1" stroke-miterlimit="10" d="M 280.21875 144.605469 L 280.21875 104.605469 L 320.21875 104.605469 L 320.21875 144.605469 Z M 280.21875 144.605469 "/>
<path fill-rule="nonzero" fill="rgb(0%25, 0%25, 100%25)" fill-opacity="1" stroke-width="1" stroke-linecap="butt" stroke-linejoin="miter" stroke="rgb(100%25, 0%25, 0%25)" stroke-opacity="1" stroke-miterlimit="10" d="M 227.871094 290 L 227.871094 250 L 267.871094 250 L 267.871094 290 Z M 227.871094 290 "/>
<path fill-rule="nonzero" fill="rgb(100%25, 0%25, 0%25)" fill-opacity="1" stroke-width="1" stroke-linecap="butt" stroke-linejoin="miter" stroke="rgb(0%25, 0%25, 100%25)" stroke-opacity="1" stroke-miterlimit="10" d="M 141.832031 188.160156 L 141.832031 148.160156 L 181.832031 148.160156 L 181.832031 188.160156 Z M 141.832031 188.160156 "/>
<path fill-rule="nonzero" fill="rgb(0%25, 0%25, 100%25)" fill-opacity="1" stroke-width="1" stroke-linecap="butt" stroke-linejoin="miter" stroke="rgb(100%25, 0%25, 0%25)" stroke-opacity="1" stroke-miterlimit="10" d="M 192.394531 54.667969 L 192.394531 14.667969 L 232.394531 14.667969 L 232.394531 54.667969 Z M 192.394531 54.667969 "/>
<path fill-rule="nonzero" fill="rgb(100%25, 0%25, 0%25)" fill-opacity="1" stroke-width="1" stroke-linecap="butt" stroke-linejoin="miter" stroke="rgb(0%25, 0%25, 100%25)" stroke-opacity="1" stroke-miterlimit="10" d="M 418.167969 152.480469 L 418.167969 112.480469 L 458.167969 112.480469 L 458.167969 152.480469 Z M 418.167969 152.480469 "/>
<path fill-rule="nonzero" fill="rgb(0%25, 0%25, 100%25)" fill-opacity="1" stroke-width="1" stroke-linecap="butt" stroke-linejoin="miter" stroke="rgb(100%25, 0%25, 0%25)" stroke-opacity="1" stroke-miterlimit="10" d="M 332.191406 50 L 332.191406 10 L 372.191406 10 L 372.191406 50 Z M 332.191406 50 "/>
<path fill-rule="nonzero" fill="rgb(100%25, 0%25, 0%25)" fill-opacity="1" stroke-width="1" stroke-linecap="butt" stroke-linejoin="miter" stroke="rgb(0%25, 0%25, 100%25)" stroke-opacity="1" stroke-miterlimit="10" d="M 279.972656 195.066406 L 279.972656 155.066406 L 319.972656 155.066406 L 319.972656 195.066406 Z M 279.972656 195.066406 "/>
<path fill-rule="nonzero" fill="rgb(0%25, 0%25, 100%25)" fill-opacity="1" stroke-width="1" stroke-linecap="butt" stroke-linejoin="miter" stroke="rgb(100%25, 0%25, 0%25)" stroke-opacity="1" stroke-miterlimit="10" d="M 367.191406 285.839844 L 367.191406 245.839844 L 407.191406 245.839844 L 407.191406 285.839844 Z M 367.191406 285.839844 "/>
</svg>)
The function should return a Colorant for a vertex:
@drawsvg begin
background("grey10")
g = smallgraph(:icosahedral)
sethue("darkorange")
drawgraph(g, layout=spring,
    vertexshapes = :circle,
    vertexshapesizes =  20,
    vertexstrokeweights = 5,
    vertexstrokecolors = (v) -> HSB(rescale(v, 1, nv(g), 360, 0), 1, 1),
    vertexfillcolors = (v)   -> HSB(rescale(v, 1, nv(g), 0, 359), 1, 1),
    )
end 600 300
or an array of colors:
@drawsvg begin
background("grey10")
sethue("orange")
g = grid((15, 15))
drawgraph(g,
    layout = squaregrid,
    vertexshapesizes = 15,
    vertexfillcolors = [RGB([Karnak.Luxor.julia_red, Luxor.julia_green,
        Luxor.julia_purple][rand(1:end)]...) for i in 1:nv(g)])
end 600 600
The following keyword arguments operate in a similar way:
vertexstrokeweights: Array | Range | :nonevertexlabeltextcolors: Array | Range | colorantvertexlabelfontsizes: Array | Range | numbervertexlabelfontfaces: Array | stringvertexlabelrotations: Array | Range | numbervertexlabeloffsetangles: Array | Range | numbervertexlabeloffsetdistances: Array | Range | number
It's possible to specify the font faces for vertex labels, but it's difficult to demonstrate when the documentation is built on machines in the cloud with unknown typographical resources. But anyway:
@drawsvg begin
background("grey10")
g = smallgraph(:pappus)
sethue("slateblue")
drawgraph(g,
    vertexlabels = 1:nv(g),
    vertexshapes = 0,
    vertexlabelfontfaces = ["Times-Roman", "Courier", "Helvetica-Bold"],
    vertexlabelfontsizes = 30)
end 600 300
Edge options
edgefunction
As with vertexfunction, the edgefunction keyword argument allows you to do anything you like when the edges are drawn, and overrides all other edge- keyword arguments. Here, the calculated coordinates of the graph and a path between two vertices aren't drawn at first, just extracted into vectors for further processing.
@drawsvg begin
background("black")
sethue("white")
g = clique_graph(16, 4)

A = Point[]
B = Point[]

drawgraph(g, layout=stress,
    edgefunction = (edgenumber, edgesrc, edgedest, from, to) -> begin
        push!(A, from),
        push!(A, to)
        end,
    vertexshapes = :none,
    )

route = a_star(g, 6, 29)

drawgraph(g, layout=stress,
    edgelist = route,
    vertexshapes = :none,
    edgefunction = (edgenumber, edgesrc, edgedest, from, to) -> begin
        push!(B, from),
        push!(B, to)
        end)

setlinejoin("bevel")
setline(0.25)

sethue("grey60")
@layer begin
    poly(A, :stroke)
end

sethue("gold")
setline(4)
@layer begin
    poly(B, :stroke)
end
circle.(B[[begin, end]], 5, :fill)
end 600 400
edgelist and edgelines
A Graphs.EdgeIterator supplied to edgelist makes only the specified edges available for drawing. Otherwise, control which edges are to be drawn by supplying numbers (or a function) to edgelines.
@drawsvg begin
background("grey10")
sethue("orange")
g = grid((15, 15))
drawgraph(g,
    layout = stress,
    vertexshapes = :none,
    edgelines = rand(1:ne(g), 30)
)
end 600 300" fill-opacity="1"/>
<path fill="none" stroke-width="1" stroke-linecap="butt" stroke-linejoin="miter" stroke="rgb(100%25, 64.705882%25, 0%25)" stroke-opacity="1" stroke-miterlimit="10" d="M 187.734375 147.863281 L 195.382812 157.113281 "/>
<path fill="none" stroke-width="1" stroke-linecap="butt" stroke-linejoin="miter" stroke="rgb(100%25, 64.705882%25, 0%25)" stroke-opacity="1" stroke-miterlimit="10" d="M 218.464844 185.722656 L 226.277344 195.285156 "/>
<path fill="none" stroke-width="1" stroke-linecap="butt" stroke-linejoin="miter" stroke="rgb(100%25, 64.705882%25, 0%25)" stroke-opacity="1" stroke-miterlimit="10" d="M 266.070312 242.308594 L 273.953125 251.539062 "/>
<path fill="none" stroke-width="1" stroke-linecap="butt" stroke-linejoin="miter" stroke="rgb(100%25, 64.705882%25, 0%25)" stroke-opacity="1" stroke-miterlimit="10" d="M 220.082031 168.839844 L 227.769531 178.328125 "/>
<path fill="none" stroke-width="1" stroke-linecap="butt" stroke-linejoin="miter" stroke="rgb(100%25, 64.705882%25, 0%25)" stroke-opacity="1" stroke-miterlimit="10" d="M 267.007812 225.171875 L 274.941406 234.40625 "/>
<path fill="none" stroke-width="1" stroke-linecap="butt" stroke-linejoin="miter" stroke="rgb(100%25, 64.705882%25, 0%25)" stroke-opacity="1" stroke-miterlimit="10" d="M 221.832031 151.632812 L 231.171875 143.742188 "/>
<path fill="none" stroke-width="1" stroke-linecap="butt" stroke-linejoin="miter" stroke="rgb(100%25, 64.705882%25, 0%25)" stroke-opacity="1" stroke-miterlimit="10" d="M 244.933594 180.007812 L 254.398438 172.128906 "/>
<path fill="none" stroke-width="1" stroke-linecap="butt" stroke-linejoin="miter" stroke="rgb(100%25, 64.705882%25, 0%25)" stroke-opacity="1" stroke-miterlimit="10" d="M 207.585938 116.242188 L 216.875 108.207031 "/>
<path fill="none" stroke-width="1" stroke-linecap="butt" stroke-linejoin="miter" stroke="rgb(100%25, 64.705882%25, 0%25)" stroke-opacity="1" stroke-miterlimit="10" d="M 223.402344 134.300781 L 232.660156 126.355469 "/>
<path fill="none" stroke-width="1" stroke-linecap="butt" stroke-linejoin="miter" stroke="rgb(100%25, 64.705882%25, 0%25)" stroke-opacity="1" stroke-miterlimit="10" d="M 254.398438 172.128906 L 262.191406 181.527344 "/>
<path fill="none" stroke-width="1" stroke-linecap="butt" stroke-linejoin="miter" stroke="rgb(100%25, 64.705882%25, 0%25)" stroke-opacity="1" stroke-miterlimit="10" d="M 270.03125 190.886719 L 279.53125 183.03125 "/>
<path fill="none" stroke-width="1" stroke-linecap="butt" stroke-linejoin="miter" stroke="rgb(100%25, 64.705882%25, 0%25)" stroke-opacity="1" stroke-miterlimit="10" d="M 309.269531 237.667969 L 316.394531 247.117188 "/>
<path fill="none" stroke-width="1" stroke-linecap="butt" stroke-linejoin="miter" stroke="rgb(100%25, 64.705882%25, 0%25)" stroke-opacity="1" stroke-miterlimit="10" d="M 234.054688 109.109375 L 243.378906 101.191406 "/>
<path fill="none" stroke-width="1" stroke-linecap="butt" stroke-linejoin="miter" stroke="rgb(100%25, 64.705882%25, 0%25)" stroke-opacity="1" stroke-miterlimit="10" d="M 257.640625 137.375 L 267.011719 129.488281 "/>
<path fill="none" stroke-width="1" stroke-linecap="butt" stroke-linejoin="miter" stroke="rgb(100%25, 64.705882%25, 0%25)" stroke-opacity="1" stroke-miterlimit="10" d="M 265.472656 146.859375 L 273.308594 156.320312 "/>
<path fill="none" stroke-width="1" stroke-linecap="butt" stroke-linejoin="miter" stroke="rgb(100%25, 64.705882%25, 0%25)" stroke-opacity="1" stroke-miterlimit="10" d="M 337.804688 214.617188 L 347.242188 206.808594 "/>
<path fill="none" stroke-width="1" stroke-linecap="butt" stroke-linejoin="miter" stroke="rgb(100%25, 64.705882%25, 0%25)" stroke-opacity="1" stroke-miterlimit="10" d="M 323.703125 178.421875 L 331.585938 187.914062 "/>
<path fill="none" stroke-width="1" stroke-linecap="butt" stroke-linejoin="miter" stroke="rgb(100%25, 64.705882%25, 0%25)" stroke-opacity="1" stroke-miterlimit="10" d="M 347.242188 206.808594 L 356.628906 198.9375 "/>
<path fill="none" stroke-width="1" stroke-linecap="butt" stroke-linejoin="miter" stroke="rgb(100%25, 64.705882%25, 0%25)" stroke-opacity="1" stroke-miterlimit="10" d="M 340.945312 180.074219 L 350.273438 172.1875 "/>
<path fill="none" stroke-width="1" stroke-linecap="butt" stroke-linejoin="miter" stroke="rgb(100%25, 64.705882%25, 0%25)" stroke-opacity="1" stroke-miterlimit="10" d="M 318.972656 134.261719 L 328.4375 126.367188 "/>
<path fill="none" stroke-width="1" stroke-linecap="butt" stroke-linejoin="miter" stroke="rgb(100%25, 64.705882%25, 0%25)" stroke-opacity="1" stroke-miterlimit="10" d="M 358.109375 181.667969 L 365.957031 191.015625 "/>
<path fill="none" stroke-width="1" stroke-linecap="butt" stroke-linejoin="miter" stroke="rgb(100%25, 64.705882%25, 0%25)" stroke-opacity="1" stroke-miterlimit="10" d="M 296.800781 88.894531 L 306.285156 81.164062 "/>
<path fill="none" stroke-width="1" stroke-linecap="butt" stroke-linejoin="miter" stroke="rgb(100%25, 64.705882%25, 0%25)" stroke-opacity="1" stroke-miterlimit="10" d="M 320.582031 116.976562 L 330.066406 109.105469 "/>
<path fill="none" stroke-width="1" stroke-linecap="butt" stroke-linejoin="miter" stroke="rgb(100%25, 64.705882%25, 0%25)" stroke-opacity="1" stroke-miterlimit="10" d="M 306.285156 81.164062 L 314.234375 90.46875 "/>
<path fill="none" stroke-width="1" stroke-linecap="butt" stroke-linejoin="miter" stroke="rgb(100%25, 64.705882%25, 0%25)" stroke-opacity="1" stroke-miterlimit="10" d="M 353.457031 137.320312 L 361.175781 146.808594 "/>
<path fill="none" stroke-width="1" stroke-linecap="butt" stroke-linejoin="miter" stroke="rgb(100%25, 64.705882%25, 0%25)" stroke-opacity="1" stroke-miterlimit="10" d="M 300.074219 54.804688 L 307.808594 64.132812 "/>
<path fill="none" stroke-width="1" stroke-linecap="butt" stroke-linejoin="miter" stroke="rgb(100%25, 64.705882%25, 0%25)" stroke-opacity="1" stroke-miterlimit="10" d="M 393.683594 167.167969 L 402.9375 159.4375 "/>
<path fill="none" stroke-width="1" stroke-linecap="butt" stroke-linejoin="miter" stroke="rgb(100%25, 64.705882%25, 0%25)" stroke-opacity="1" stroke-miterlimit="10" d="M 356.75 102.75 L 364.558594 112.1875 "/>
<path fill="none" stroke-width="1" stroke-linecap="butt" stroke-linejoin="miter" stroke="rgb(100%25, 64.705882%25, 0%25)" stroke-opacity="1" stroke-miterlimit="10" d="M 395.242188 150.152344 L 402.9375 159.4375 "/>
<path fill="none" stroke-width="1" stroke-linecap="butt" stroke-linejoin="miter" stroke="rgb(100%25, 64.705882%25, 0%25)" stroke-opacity="1" stroke-miterlimit="10" d="M 373.769531 104.6875 L 381.59375 114.277344 "/>
</svg>)
edgelist is useful for drawing paths - a sequence of edges. For example, if you use a_star() to find the shortest path between two vertices, you can draw the edges with this keyword. It's useful to draw the graph twice, once with all edges, once with selected edges.
@drawsvg begin
background("grey10")
g = grid((15, 15))

astar = a_star(g, 1, nv(g))

sethue("orange")
drawgraph(g,
    layout = stress,
    vertexshapes = :none)

sethue("cyan")
drawgraph(g,
    layout = stress,
    vertexshapes = :none,
    edgestrokeweights = 5,
    edgelist = astar)
end 600 300
For more interesting edges, you can use Luxor arrows, and you can also define functions to create all kinds of graphical detail:
gd = DiGraph()
add_vertices!(gd, 4)
add_edge!(gd, 1, 2)
add_edge!(gd, 1, 3)
add_edge!(gd, 2, 3)
add_edge!(gd, 1, 4) # vertex 1 to vertex 4
add_edge!(gd, 4, 1) # vertex 4 to vertex 1

@drawsvg begin
    background("grey10")
    sethue("thistle1")
    drawgraph(gd, vertexlabels = [1, 2, 3, 4],
        edgefunction = (n, s, d, f, t) -> begin
            arrow(f, t, [10, 10],
            decoration = 0.75,
            decorate = () -> begin
                sethue(HSB(60n, 0.7, 0.8))
                ngon(O, 10, 3, 0, :fill)
            end,
            arrowheadfunction= (f, t, a) -> ()
            )
        end
    )
end 600 300" fill-opacity="1"/>
<path fill="none" stroke-width="1" stroke-linecap="butt" stroke-linejoin="miter" stroke="rgb(100%25, 88.235294%25, 100%25)" stroke-opacity="1" stroke-miterlimit="10" d="M 420 150 C 393.136719 197.355469 353.613281 237.070312 307.359375 265.589844 "/>
<path fill-rule="nonzero" fill="rgb(80%25, 80%25, 24%25)" fill-opacity="1" d="M 334.320312 236.207031 L 344.859375 249.953125 L 327.683594 252.207031 Z M 334.320312 236.207031 "/>
<path fill="none" stroke-width="1" stroke-linecap="butt" stroke-linejoin="miter" stroke="rgb(100%25, 88.235294%25, 100%25)" stroke-opacity="1" stroke-miterlimit="10" d="M 420 150 C 343.3125 164.816406 263.996094 164.636719 187.125 151.277344 "/>
<path fill-rule="nonzero" fill="rgb(24%25, 80%25, 24%25)" fill-opacity="1" d="M 245.535156 150.15625 L 243.917969 167.402344 L 229.792969 157.378906 Z M 245.535156 150.15625 "/>
<path fill="none" stroke-width="1" stroke-linecap="butt" stroke-linejoin="miter" stroke="rgb(100%25, 88.235294%25, 100%25)" stroke-opacity="1" stroke-miterlimit="10" d="M 420 150 C 372.644531 123.136719 332.929688 83.613281 304.410156 37.359375 "/>
<path fill-rule="nonzero" fill="rgb(24%25, 80%25, 80%25)" fill-opacity="1" d="M 333.792969 64.320312 L 320.046875 74.859375 L 317.792969 57.683594 Z M 333.792969 64.320312 "/>
<path fill="none" stroke-width="1" stroke-linecap="butt" stroke-linejoin="miter" stroke="rgb(100%25, 88.235294%25, 100%25)" stroke-opacity="1" stroke-miterlimit="10" d="M 300 270 C 252.644531 243.136719 212.929688 203.613281 184.410156 157.359375 "/>
<path fill-rule="nonzero" fill="rgb(24%25, 24%25, 80%25)" fill-opacity="1" d="M 213.792969 184.320312 L 200.046875 194.859375 L 197.792969 177.683594 Z M 213.792969 184.320312 "/>
<path fill="none" stroke-width="1" stroke-linecap="butt" stroke-linejoin="miter" stroke="rgb(100%25, 88.235294%25, 100%25)" stroke-opacity="1" stroke-miterlimit="10" d="M 300 30 C 347.355469 56.863281 387.070312 96.386719 415.589844 142.640625 "/>
<path fill-rule="nonzero" fill="rgb(80%25, 24%25, 80%25)" fill-opacity="1" d="M 386.207031 115.679688 L 399.953125 105.140625 L 402.207031 122.316406 Z M 386.207031 115.679688 "/>
<path fill-rule="nonzero" fill="rgb(100%25, 88.235294%25, 100%25)" fill-opacity="1" stroke-width="1" stroke-linecap="butt" stroke-linejoin="miter" stroke="rgb(100%25, 88.235294%25, 100%25)" stroke-opacity="1" stroke-miterlimit="10" d="M 426 150 C 426 153.3125 423.3125 156 420 156 C 416.6875 156 414 153.3125 414 150 C 414 146.6875 416.6875 144 420 144 C 423.3125 144 426 146.6875 426 150 Z M 426 150 "/>
<g fill="rgb(0%25, 0%25, 0%25)" fill-opacity="1">
<use xlink:href="%23glyph-125525-0-0" x="416.818848" y="153.64502"/>
</g>
<path fill-rule="nonzero" fill="rgb(100%25, 88.235294%25, 100%25)" fill-opacity="1" stroke-width="1" stroke-linecap="butt" stroke-linejoin="miter" stroke="rgb(100%25, 88.235294%25, 100%25)" stroke-opacity="1" stroke-miterlimit="10" d="M 306 270 C 306 273.3125 303.3125 276 300 276 C 296.6875 276 294 273.3125 294 270 C 294 266.6875 296.6875 264 300 264 C 303.3125 264 306 266.6875 306 270 Z M 306 270 "/>
<g fill="rgb(0%25, 0%25, 0%25)" fill-opacity="1">
<use xlink:href="%23glyph-125525-0-1" x="296.818848" y="273.710938"/>
</g>
<path fill-rule="nonzero" fill="rgb(100%25, 88.235294%25, 100%25)" fill-opacity="1" stroke-width="1" stroke-linecap="butt" stroke-linejoin="miter" stroke="rgb(100%25, 88.235294%25, 100%25)" stroke-opacity="1" stroke-miterlimit="10" d="M 186 150 C 186 153.3125 183.3125 156 180 156 C 176.6875 156 174 153.3125 174 150 C 174 146.6875 176.6875 144 180 144 C 183.3125 144 186 146.6875 186 150 Z M 186 150 "/>
<g fill="rgb(0%25, 0%25, 0%25)" fill-opacity="1">
<use xlink:href="%23glyph-125525-0-2" x="176.818848" y="153.710938"/>
</g>
<path fill-rule="nonzero" fill="rgb(100%25, 88.235294%25, 100%25)" fill-opacity="1" stroke-width="1" stroke-linecap="butt" stroke-linejoin="miter" stroke="rgb(100%25, 88.235294%25, 100%25)" stroke-opacity="1" stroke-miterlimit="10" d="M 306 30 C 306 33.3125 303.3125 36 300 36 C 296.6875 36 294 33.3125 294 30 C 294 26.6875 296.6875 24 300 24 C 303.3125 24 306 26.6875 306 30 Z M 306 30 "/>
<g fill="rgb(0%25, 0%25, 0%25)" fill-opacity="1">
<use xlink:href="%23glyph-125525-0-3" x="296.818848" y="33.64502"/>
</g>
</svg>)
@drawsvg begin
background("grey10")
g = star_graph(12)
fontsize(20)
sethue("slateblue")
drawgraph(g,
    layout=spring,
    vertexshapes = 0,
    vertexlabels = 1:nv(g),
    vertexlabelfontsizes = 12,
    edgestrokecolors = distinguishable_colors(ne(g)),
    edgelines = (k, s, d, f, t) ->
        arrow(f, between(f, t, .95), [20, -45],
            linewidth = 5,
            arrowheadlength = 15,
            arrowheadangle = π/7,
            decorate = () -> begin
                    sethue("purple")
                    circle(O, 15, :fill)
                    sethue("white")
                    text(string(k), angle = -getrotation(), halign = :center, valign=:middle)
                end,
            decoration = .7))
end 600 400
Edge labels
Use edgelabels, edgelabelcolors, edgelabelrotations, etc. to control the appearance of the labels alongside edges.
@drawsvg begin
background("grey10")
g = smallgraph(:dodecahedral)
g = complete_graph(5)
sethue("orange")
fontsize(20)
drawgraph(g, layout=stress,
    vertexshapes = :none,
    vertexlabels = "vertex",
    vertexlabeltextcolors = colorant"cyan",
    edgelabels = ["edge"],
    edgestrokecolors = colorant"orange",
    edgelabelcolors = colorant"pink",
    )
end 600 500
edgelabels can also be a dictionary, where the keys are tuples: (src, dst), and the values are the text labels.
g = complete_graph(5)
edgelabeldict = Dict()
n = nv(g)
for i in 1:n
    for j in 1:n
        edgelabeldict[(i, j)] = "($i, $j)"
    end
end

@drawsvg begin
    background("grey10")
    drawgraph(g, layout=stress,
        vertexshapes = :circle,
        vertexlabels = 1:n,
        edgestrokecolors = colorant"orange",
        edgelabelcolors = colorant"white",
        edgelabels = edgelabeldict)
end 600 350
The edgelabels keyword argument can also accept a function with five arguments: edgenumber, source, destination, from and to. In this example, the graphical distances between the two vertex positions provide the annotations for each edge.
@drawsvg begin
background("grey10")
g = smallgraph(:dodecahedral)
g = complete_graph(5)
fontsize(20)
drawgraph(g, layout=stress,
    vertexshapes = :none,
    edgestrokecolors = colorant"orange",
    edgelabels = (k, src, dest, f, t) -> begin
        @layer begin
            sethue("white")
            θ = slope(f, t)
            text(string(round(distance(f, t), digits=1)),
                midpoint(f, t),
                angle=θ,
                halign=:center)
        end
    end)
end 600 500
The more code you're prepared to write, the more elaborate your labels can be:
sources      = [1,2,1]
destinations = [2,3,3]
weights      = [0.5, 0.8, 2.0]
g = SimpleWeightedGraph(sources, destinations, weights)
@drawsvg begin
background("grey10")
sethue("gold")
drawgraph(g,
    vertexlabels = 1:nv(g),
    vertexshapesizes = 20,
    vertexlabelfontsizes = 30,
    edgecurvature = 10,
    edgegaps = 25,
    edgelabels = (edgenumber, edgesrc, edgedest, from, to) -> begin
        @layer begin
            sethue("black")
            box(midpoint(from, to), 50, 30, :fill)
        end
        box(midpoint(from, to), 50, 30, :stroke)
        fontsize(16)
        text(string(get_weight(g, edgesrc, edgedest)),
            midpoint(from, to),
            halign=:center,
            valign=:middle)
    end)
end 600 300
For directed weighted graphs, each edge can have two weights. This makes it slightly more difficult to draw the labels automatically. You could write an edge labelling function that calculates the slope of the edge and positions the label accordingly:
function f(edgenumber, edgesrc, edgedest, from::Point, to::Point)
    sl = slope(from, to)
    wt = g.weights[edgesrc, edgedest]
    if sl > π
        label(string(wt), :e, midpoint(from, to))
    else
        label(string(wt), :w, midpoint(from, to))
    end
end

...
    edgelabels=f,
...
edgelist
This example draws the graph more than once; once with all the edges, once with only the edges in edgelist, where edgelist is the path from vertex 15 to vertex 17, drawn in a pale translucent yellow, and once to draw the vertices on the path "X marks the spot" cyan-colored crosses.
@drawsvg begin
    background("grey10")
    g = smallgraph(:karate)
    sethue("slateblue")

    drawgraph(g, layout = stress,
        vertexlabels = 1:nv(g),
        vertexshapes = :circle,
        vertexshapesizes = 10,
        vertexlabelfontsizes = 10)

    astar = a_star(g, 15, 17)

    drawgraph(g,
        layout=stress,
        vertexshapes = :none,
        edgelist = astar,
        edgestrokecolors=RGBA(1, 1, 0, 0.5),
        edgestrokeweights=10)

    drawgraph(g,
        layout=stress,
        edgelines=0,
        vertexshapes = (v) -> v ∈ src.(astar) && polycross(O, 20, 4, 0.5, π/4, :fill),
             vertexfillcolors = (v) -> v ∈ src.(astar) && colorant"cyan"
        )
end 600 600
edgecurvature and edgegaps
The edgecurvature keyword determines the curvature of the edges.
The edgegaps keyword sets the distances between the ends of the edges and the vertex positions.
Units, as everywhere in Karnak, are points/pixels (1 point is 0.3527mm).
g = grid((3, 3))

# add some self-loops
for e in edges(g)
    add_edge!(g, src(e), src(e))
    add_edge!(g, dst(e), dst(e))
end

@drawsvg begin
    background("grey10")
    sethue("white")
    for c in 1:10
        drawgraph(g,
            margin=70,
            vertexshapes = :none,
            edgegaps = 3c,
            edgecurvature = 3c,
            edgestrokecolors = HSB(36c, .8, .8),
            edgestrokeweights = 0.5,
            layout=squaregrid)
    end
end 600 500
The value for the edge gap (either as supplied in vector, range, or scalar form, or calculated and returned by a function) applies to both ends of an edge. This is a minor issue for cases where, for example, the vertex shapes are different sizes, and the gaps need to be calculated independently for each end of a single edge. You'll have to calculate and draw the edges yourself, as shown in this unnecessarily animated example:
using Karnak, Graphs, Colors
function frame(scene, framenumber, g, vertexsizes)
    background("black")
    eased_n = scene.easingfunction(framenumber - scene.framerange.start,
        0, 1, (scene.framerange.stop + 1) - scene.framerange.start)
    a = 10 + vertexsizes[1] * abs(sin(0 + rescale(eased_n, 0, 1, 0, π)))
    b = 10 + vertexsizes[2] * abs(sin(π / 4 + rescale(eased_n, 0, 1, 0, π)))
    c = 10 + vertexsizes[3] * abs(sin(π / 3 + rescale(eased_n, 0, 1, 0, π)))
    d = 10 + vertexsizes[4] * abs(sin(rescale(eased_n, 0, 1, 0, π)))
    newvertexsizes = [a, b, c, d]
    sethue("gold")
    drawgraph(g,
        margin=80,
        vertexshapesizes=newvertexsizes,
        vertexfillcolors=[c for c in Colors.JULIA_LOGO_COLORS |> values],
        edgefunction=(args...) -> begin
            edgenumber, edgesrc, edgedest, from, to = args
            d = distance(from, to)
            startpoint = between(from, to, newvertexsizes[edgesrc] / d)
            endpoint = between(from, to, 1 - newvertexsizes[edgedest] / d)
            arrow(startpoint, endpoint)
        end)
end

function main()
    g = complete_digraph(4)
    vertexsizes = [20, 35, 50, 60]
    amovie = Movie(800, 600, "gap animation")
    animate(amovie,
        Scene(amovie, (s, f) -> frame(s, f, g, vertexsizes), 1:40),
        framerate=15,
        creategif=true,
        pathname=joinpath(dirname(dirname(pathof(Karnak))) * "/docs/src/assets/figures/edgegapanimation.gif"))
end

main()
edgestrokecolors and edgestrokeweights
g = barbell_graph(3, 3)
@drawsvg begin
    background("grey10")
    fontsize(30)
    sethue("white")
    drawgraph(g,
        layout=stress,
        edgelabels = 1:ne(g),
        edgecurvature = 10,
        edgestrokeweights = 2 * (1:ne(g)),
        edgelabelcolors = colorant"white",
        edgestrokecolors= (n, from, to, edgesrc, edgedest) -> HSB(rescale(n, 1, ne(g), 0, 359), .8, .8))
end 600 500
edgedashpatterns
Line dashes work the same as in Luxor.jl, ie they're numbers in an array, with line length following by space length. If you want to alternate between dash patterns, supply an array of pattern arrays.
g = grid((5, 5))
@drawsvg begin
    background("grey10")
    sethue("white")
    drawgraph(g,
        layout=squaregrid,
        edgestrokeweights = 5,
        edgelabels = (edgenumber, edgesrc, edgedest, from::Point, to::Point) ->
            begin
                labeltext = ["a", "b", "c"][mod1(edgenumber, end)]
                label(labeltext, :se, midpoint(from, to), offset=5)
            end,
        edgedashpatterns = [[20, 10, 1, 10], [20, 10], [0.5, 10]],
        edgelabelfontsizes = 20,
        vertexshapesizes = 2,
        edgestrokecolors=(edgenumber, from, to, src, dst) ->
            HSB(rescale(edgenumber, 1, ne(g), 0, 359), .8, .8)
          )
end 600 400
Arrow control for directed graphs: edgearrows
For directed graphs only, edges are automatically drawn with an arrowhead at the destination point of the edge, to indicate the direction.
To hide the arrows for directed graphs, use edgearrows=false. Or you can specify an array of Booleans to control each edge's destination arrow.
gd = DiGraph()
add_vertices!(gd, 4)
add_edge!(gd, 1, 2)
add_edge!(gd, 1, 3)
add_edge!(gd, 2, 3)
add_edge!(gd, 1, 4) # vertex 1 to vertex 4
add_edge!(gd, 4, 1) # vertex 4 to vertex 1

@drawsvg begin
    background("grey10")
    sethue("thistle1")
    tiles = Tiler(600, 600, 1, 2)
    @layer begin
        translate(first(tiles[1]))
        scale(0.5)
        drawgraph(gd,
            vertexlabels=[1, 2, 3, 4],
            edgearrows=false,
            edgecurvature=50,
            )
        end
    @layer begin
        translate(first(tiles[2]))
        drawgraph(gd,
            edgearrows=[true, false, true, false, false],
            edgelabels=(n, s, d, f, t) -> begin
                l = string.([true, false, true, false, false])[n]
                label(l, slope(f, t), offset=10, midpoint(f, t))
                end,
            vertexlabels=[1, 2, 3, 4],
            edgecurvature=5,
            margin=20
        )
    end
end 600 300
If you pass a function to edgearrows, the arrow will be drawn by the function, rather than by the default arrow rendering.
using Luxor, Karnak, Graphs

gd = DiGraph()
add_vertices!(gd, 4)
add_edge!(gd, 1, 2)
add_edge!(gd, 1, 3)
add_edge!(gd, 2, 3)
add_edge!(gd, 1, 4) # vertex 1 to vertex 4
add_edge!(gd, 4, 1) # vertex 4 to vertex 1

function edgearrowfunc(edgenumber, edgesrc, edgedest, from, to)
    sethue(Luxor.Colors.HSL(360rand(), 0.8, 0.7))
    s = slope(from, to)
    arrow(
        between(from, to, 0.05),
        between(from, to, 0.95),
        [25 * s, -25 * s],
        startarrow=false,
        finisharrow=true, :stroke, linewidth=5, arrowheadlength=30)
end

@drawsvg begin
    background("grey10")
    sethue("thistle1")
    cells = Table([300], [300, 300])
    @show cells
    @layer begin
        translate(cells[1])
        drawgraph(gd,
            vertexlabels=[1, 2, 3, 4],
            edgearrows=edgearrowfunc, # named function
        )
    end
    @layer begin
        translate(cells[2])
        drawgraph(gd,
            vertexlabels=[1, 2, 3, 4],
            edgearrows= (n, s, d, f, t) -> begin # anon function
                adjusted_from = between(f, t, 0.05)
                adjusted_to = between(f, t, 0.95)
                # thicker lines for destination vertices with more neighbors
                linewidth = rescale(length(neighbors(gd, d)), 0, 3, 0.5, 5)
                arrow(adjusted_from, adjusted_to, [10, 15], linewidth=linewidth, arrowheadlength=20)
            end,
        )
    end
end 600 300
If you use this function, the edgegaps keyword information is not used.
The edgearrows keyword is only for directed graphs. Use edgefunction to draw custom edges for all types of graph.
vertexfunction and edgefunction allow you to pass control over the drawing process completely to these two functions.